

Computer Analytics helps you understand your Perplexity Computer usage, manage your credit budget, and review how Computer fits into your workflow.
You can view your personal analytics if you use Perplexity Pro or Perplexity Max, or belong to an Enterprise organization.
What you can do
Break down your own credit usage by day — see exactly how your credits have been spent over time.
View credit usage by model — the Credit usage chart shows total usage or a breakdown by model.
Activity breakdowns
Artifacts generated by your tasks
Top Connectors you’ve used
Top Skills you’ve invoked
Top projects where you run Computer
Your tasks grouped by duration
Open your personal analytics
Go to All settings > Analytics.
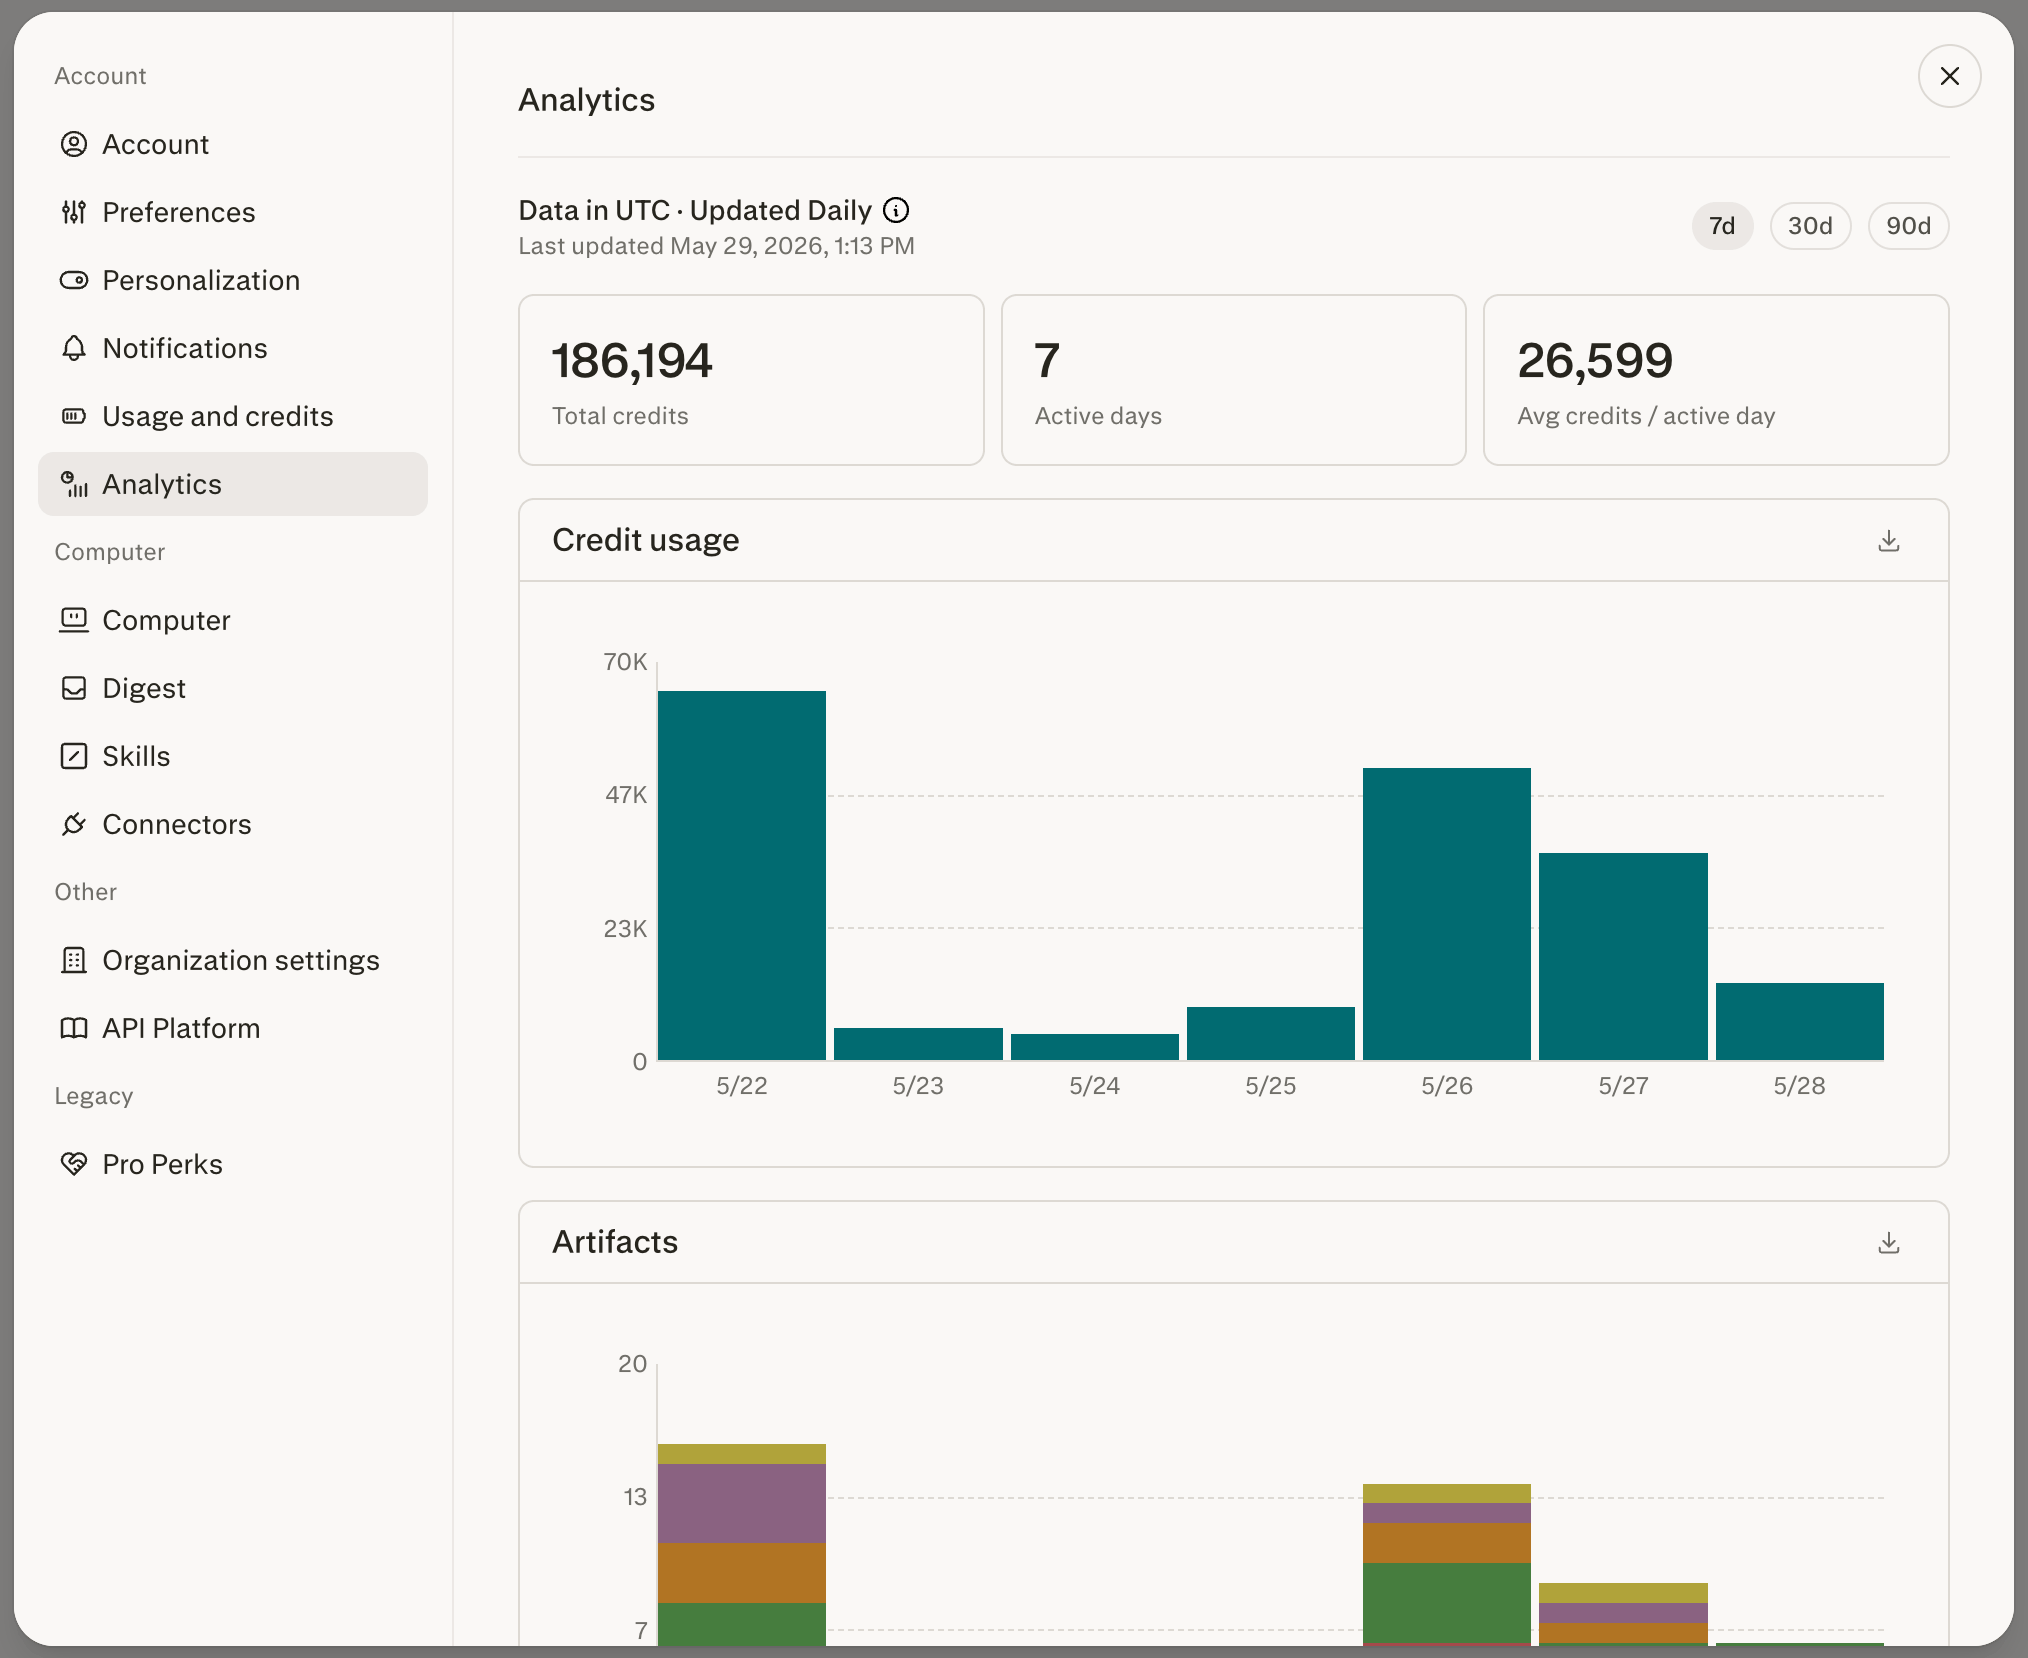
Figure 1 — Computer Analytics for your own usage.
Frequently asked questions
How do I break down credit usage by model?
How do I break down credit usage by model?
Open the Credit usage chart. If the Group by control is shown on the Credit usage chart, use it to select the model breakdown. When only one breakdown is available, the chart shows it directly.
Can organization members see other members' usage?
Can organization members see other members' usage?
Yes. You can view the usage leaderboard if an administrator enables member access. Your personal usage charts still show only your own activity.
How often is the data refreshed?
How often is the data refreshed?
Data is normally refreshed once per day, but reporting delays can mean the latest data is older than the previous day. Check the last-updated timestamp on the analytics page before using the data for reporting.
Where can I learn more about credits?
Where can I learn more about credits?
For details on how credits are calculated and what counts toward your usage, see How credits work on Perplexity (Pro and Max) or How Credits Work for Enterprise organizations — Member Guide (Enterprise organization members).
For Enterprise administrators
If you are an Enterprise administrator, see Computer Analytics for Enterprise administrators for organization-level analytics and reporting options.
Need more help?
Contact us via Help > Contact Support. Include the task link if your question is about a specific Computer task.