

Understand your organization’s Perplexity usage
Use the same reporting period when comparing Search and Perplexity Computer activity.What is Analytics?
Analytics is the organization usage dashboard in Settings. It can include three sections: Overview, Computer, and Connectors.Usage charts and exports
Overview
Core metrics
The Overview section summarizes activity for the selected reporting period:- Total queries: Queries across your organization.
- Active members: Members active during the selected period, shown alongside the organization’s total member count.
- Avg queries / active member: Total queries divided by active members, not by all seats.
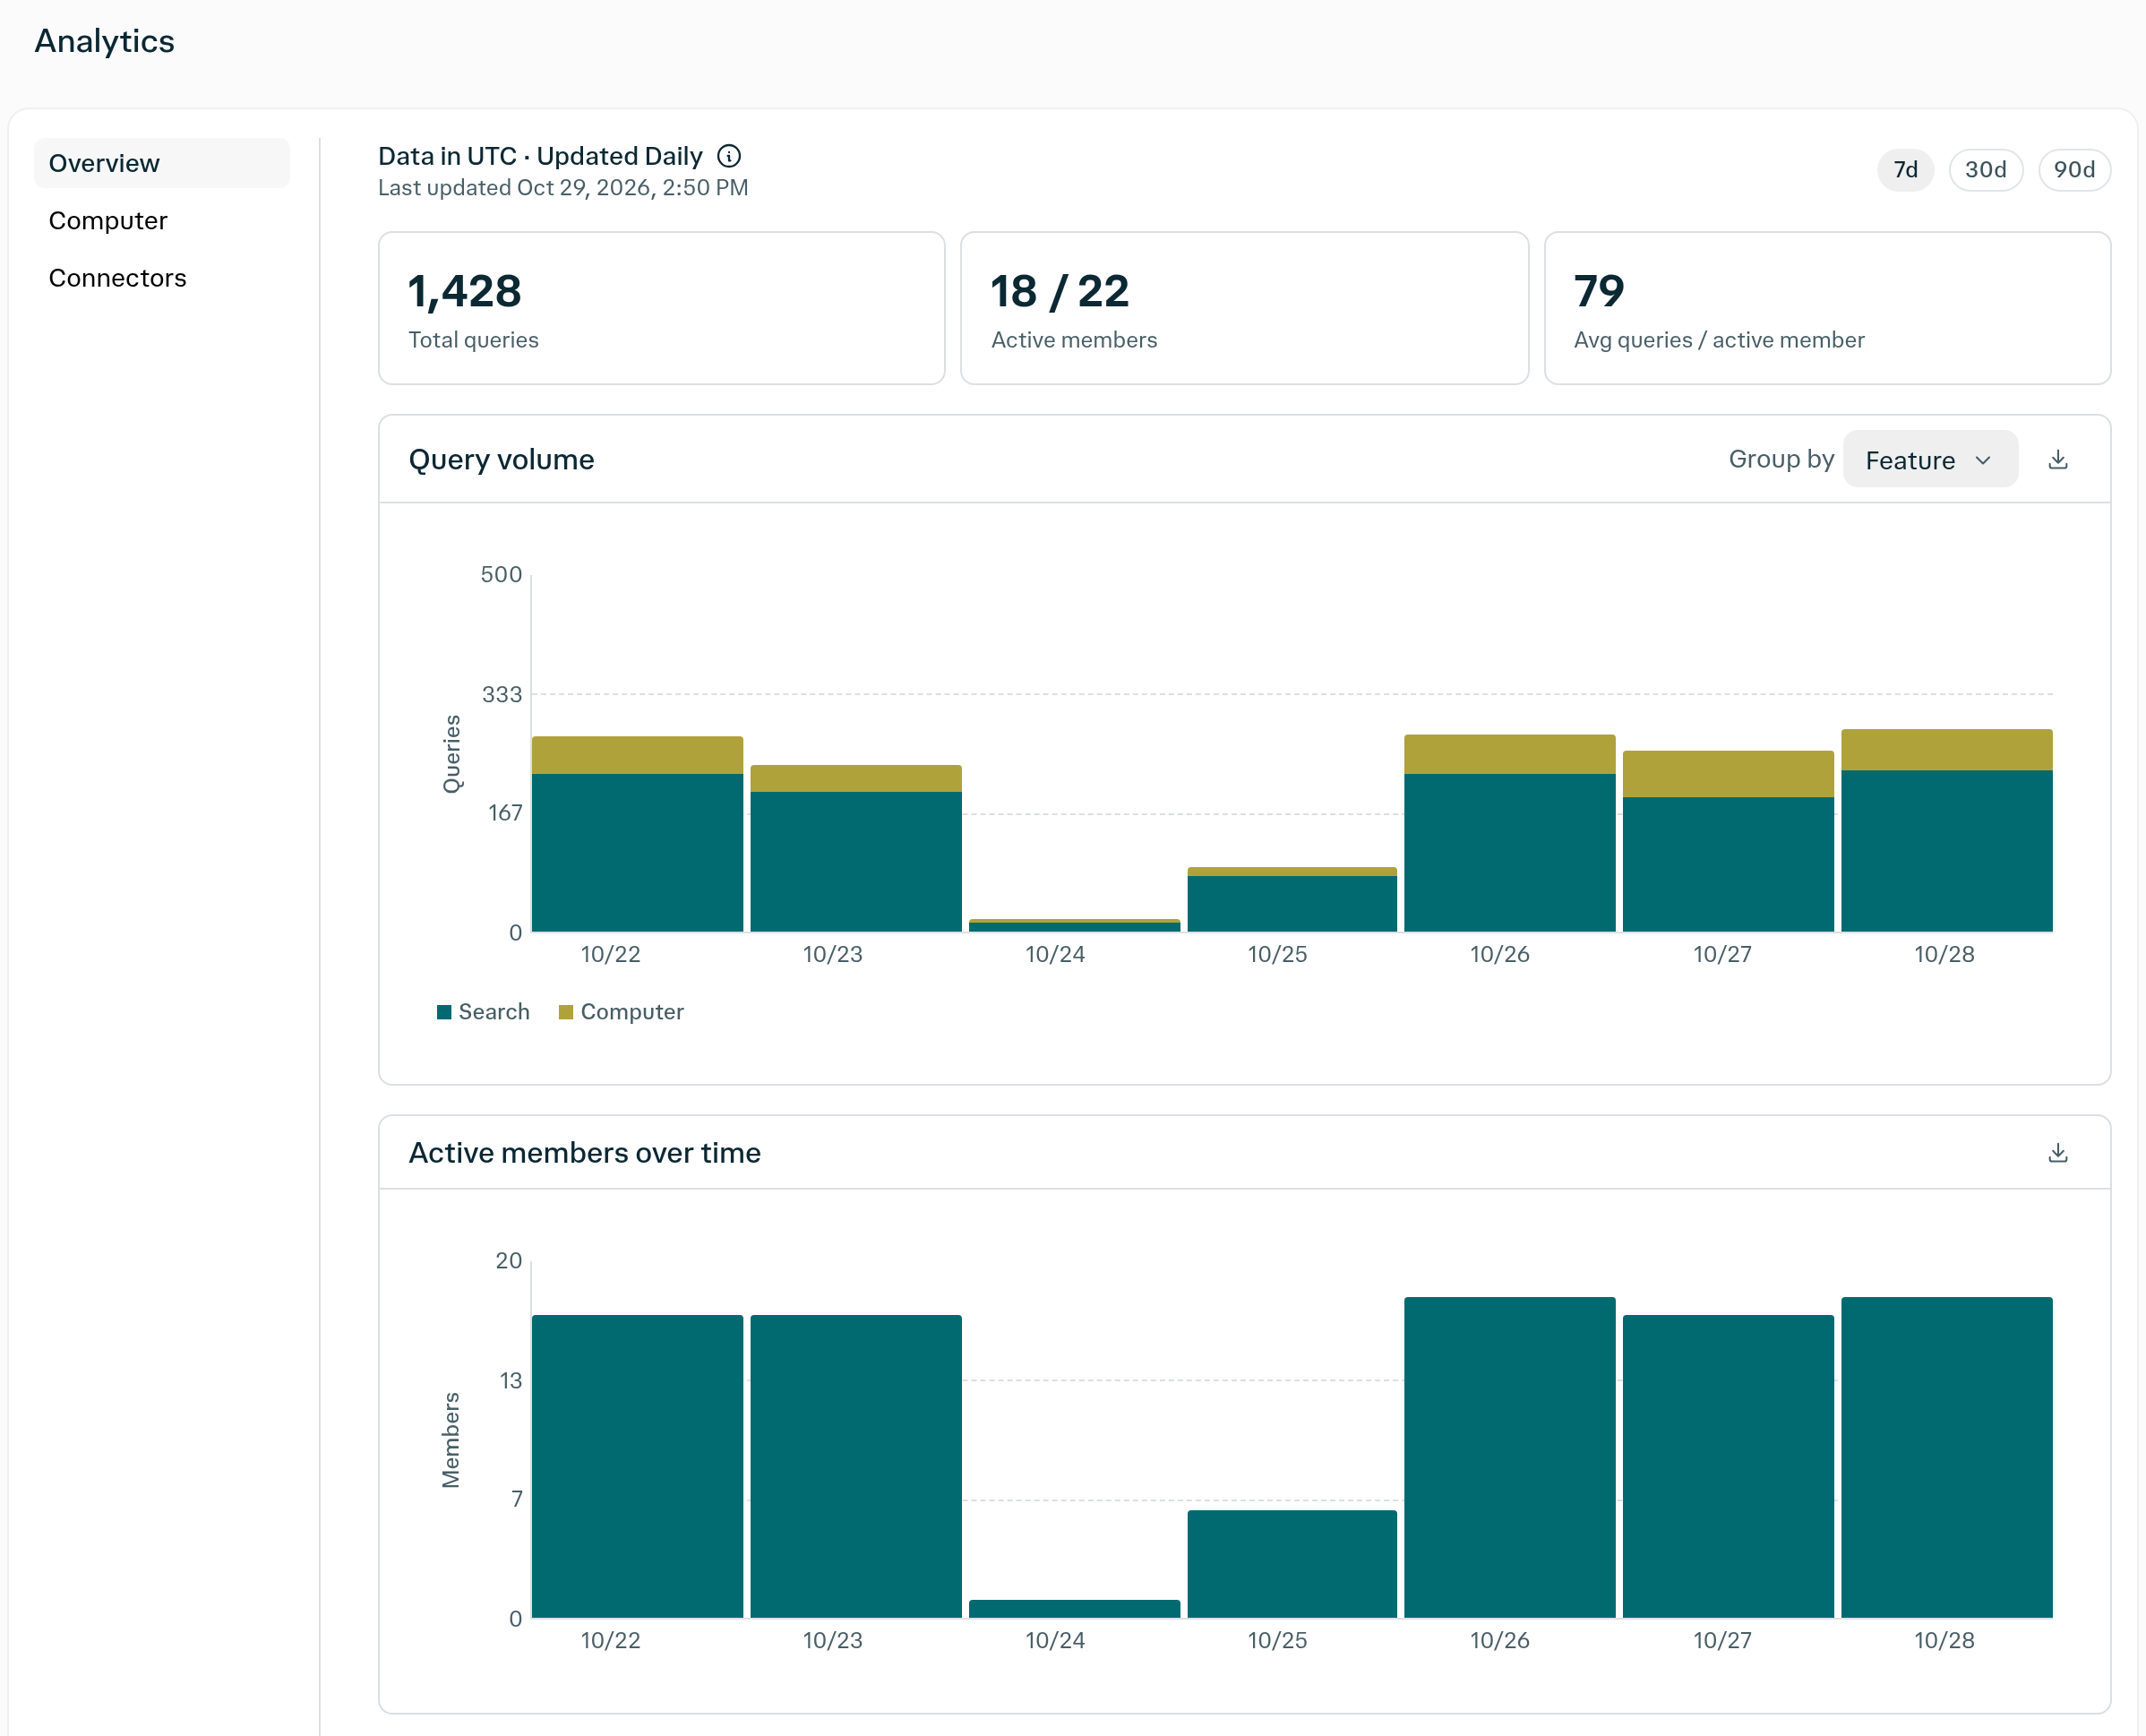
Figure 1 — Overview in the English interface, with the 7-day range selected.
- Query volume: View queries over time, with breakdowns by feature, model, or model family. The feature breakdown distinguishes Search from Computer.
- Active members over time: Track daily active members.
- Activity by member: Compare each member’s total queries and Search and Computer activity.
- Feature usage: Switch between the Projects and Comet breakdowns. The Projects breakdown compares Projects with Not in Projects.
Computer
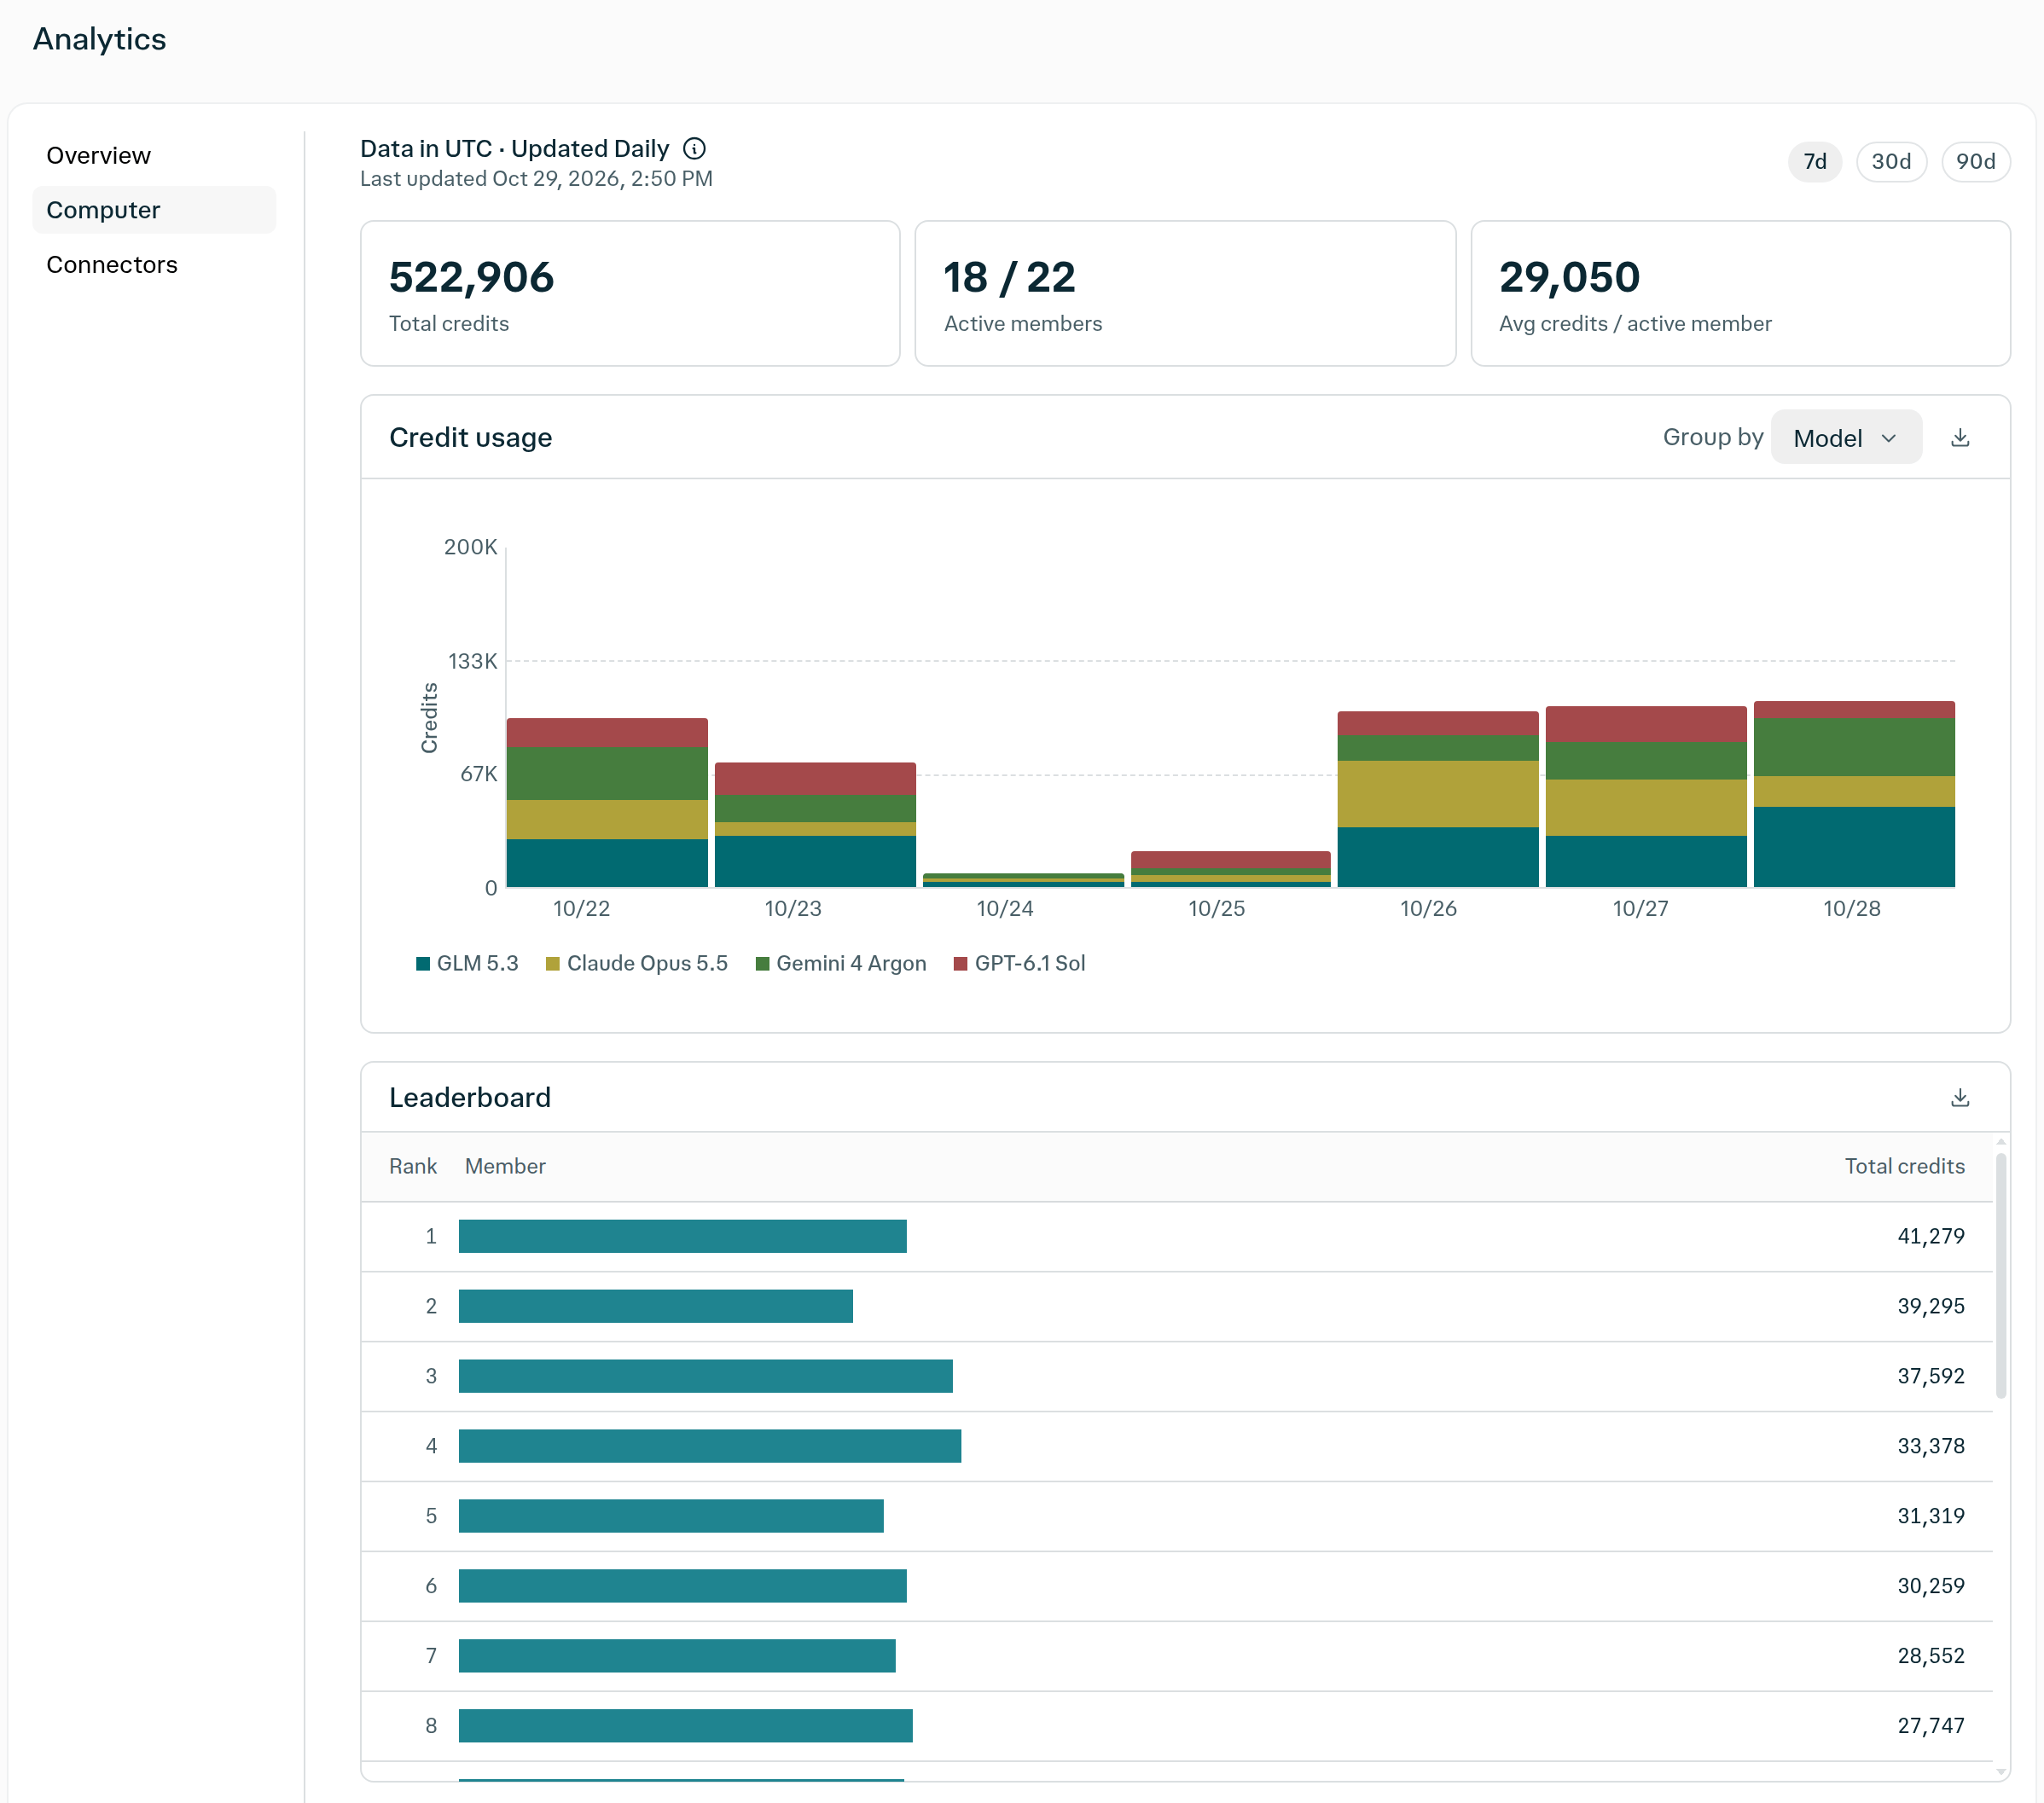
Figure 2 — Computer in the English interface, with the 7-day range selected and member email addresses hidden.
- Credits and members: Review total credits, active members, and average credits per active member for the selected period.
- Credit usage: Explore the credit-usage chart and its available breakdowns.
- Member comparison: Use Leaderboard to compare total credits by member.
- Activity details: Review artifacts, Connectors, skills, projects, and task durations.
Connectors
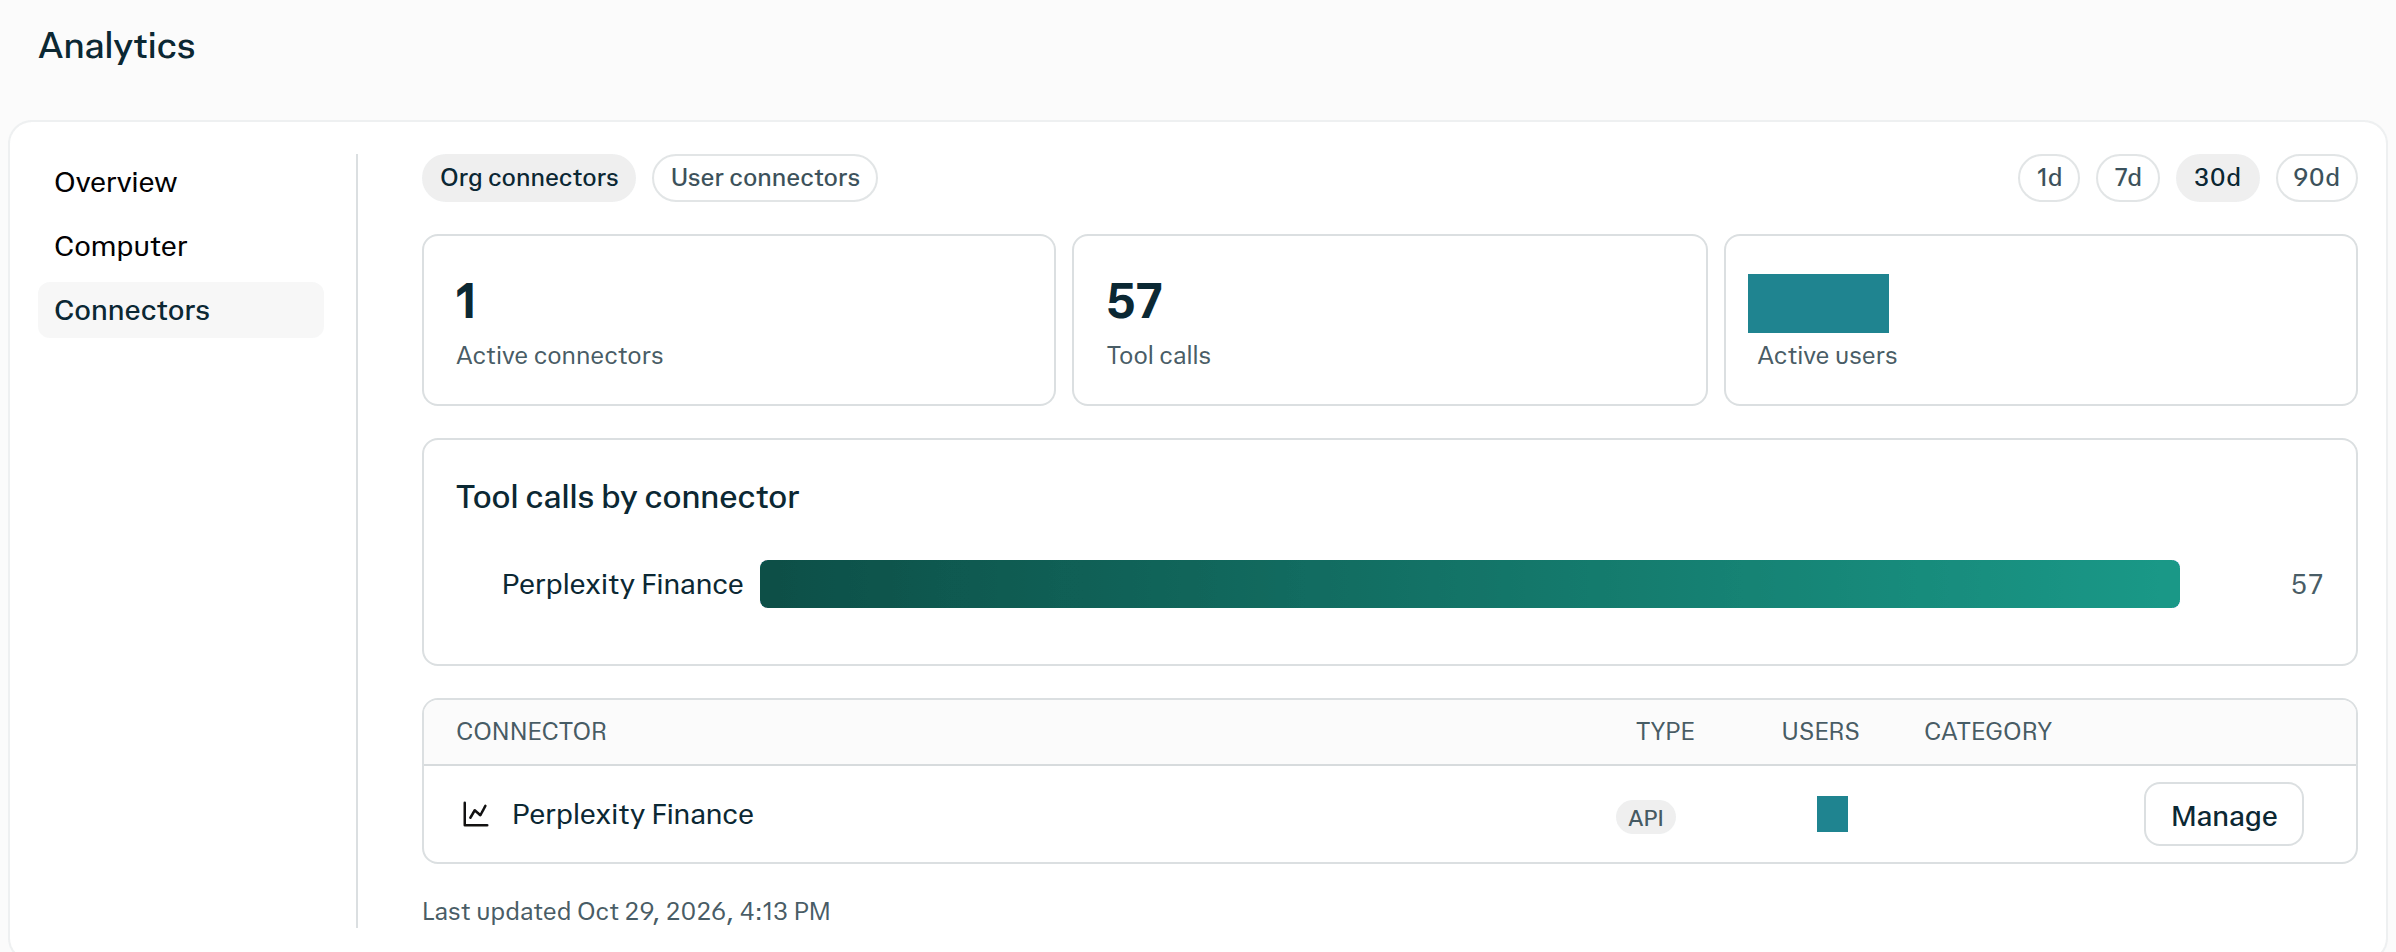
Figure 3 — Org connectors in the English interface, with the 30-day range selected and user counts redacted in the top summary and table.
- Org connectors: Use this view for organization-wide Connectors activity.
- User connectors: Search for a member by email and select them to review their Connectors usage.
- Tool calls by connector: Compare tool-call totals by connector for the selected period.
The Connectors chart within Computer and the separate Connectors section measure different
activity. Do not treat their totals as interchangeable.
Reporting periods and downloads
Select a 7-, 30-, or 90-day reporting period. Where available, select Group by to change a chart’s breakdown. On supported charts and tables in Overview and Computer, select the download icon (Download CSV) to export a comma-separated values (CSV) file. Connectors also offers a 1-day period. Overview and Computer show data in Coordinated Universal Time (UTC) and refresh daily. Check the update timestamp when interpreting recent activity. For custom reporting, see the Analytics application programming interface (API) documentation. Its access requirements, datasets, and date windows differ from the dashboard.How to access Analytics
To open Analytics, you need an active Enterprise subscription and the View usage analytics permission. The administrator role includes this permission by default.- Sign in to your Enterprise organization.
- Open Settings.
- In your organization’s settings, select Analytics.
If you can open Analytics but Connectors data does not load, ask your organization administrator to check your access or contact Support.
Related articles
- Computer Analytics for Enterprise administrators
- Enterprise roles and permissions
- How credits work for Enterprise organizations — admin guide
- Computer for Enterprise