Query Snowflake to find which campaigns drove the highest conversion

Query Snowflake to find which campaigns drove the highest conversion

Query Snowflake to find which campaigns drove the highest conversion

Apps & files

Apps & files

Connectors

Connectors

Marketing

Marketing

Overview

Overview

Overview

Use your Snowflake warehouse to identify which marketing campaigns drove the strongest conversion performance last month and turn those insights into a repeatable dashboard. This helps your team quickly see which channels and creatives are most efficient so you can reallocate budget toward campaigns that reliably convert

Use your Snowflake warehouse to identify which marketing campaigns drove the strongest conversion performance last month and turn those insights into a repeatable dashboard. This helps your team quickly see which channels and creatives are most efficient so you can reallocate budget toward campaigns that reliably convert

Use your Snowflake warehouse to identify which marketing campaigns drove the strongest conversion performance last month and turn those insights into a repeatable dashboard. This helps your team quickly see which channels and creatives are most efficient so you can reallocate budget toward campaigns that reliably convert

Query:

Query:

Query:

Looking at our Snowflake data, which campaigns had the highest conversion rate last month? Create a dashboard so we can track performance.

Looking at our Snowflake data, which campaigns had the highest conversion rate last month? Create a dashboard so we can track performance.

Key output

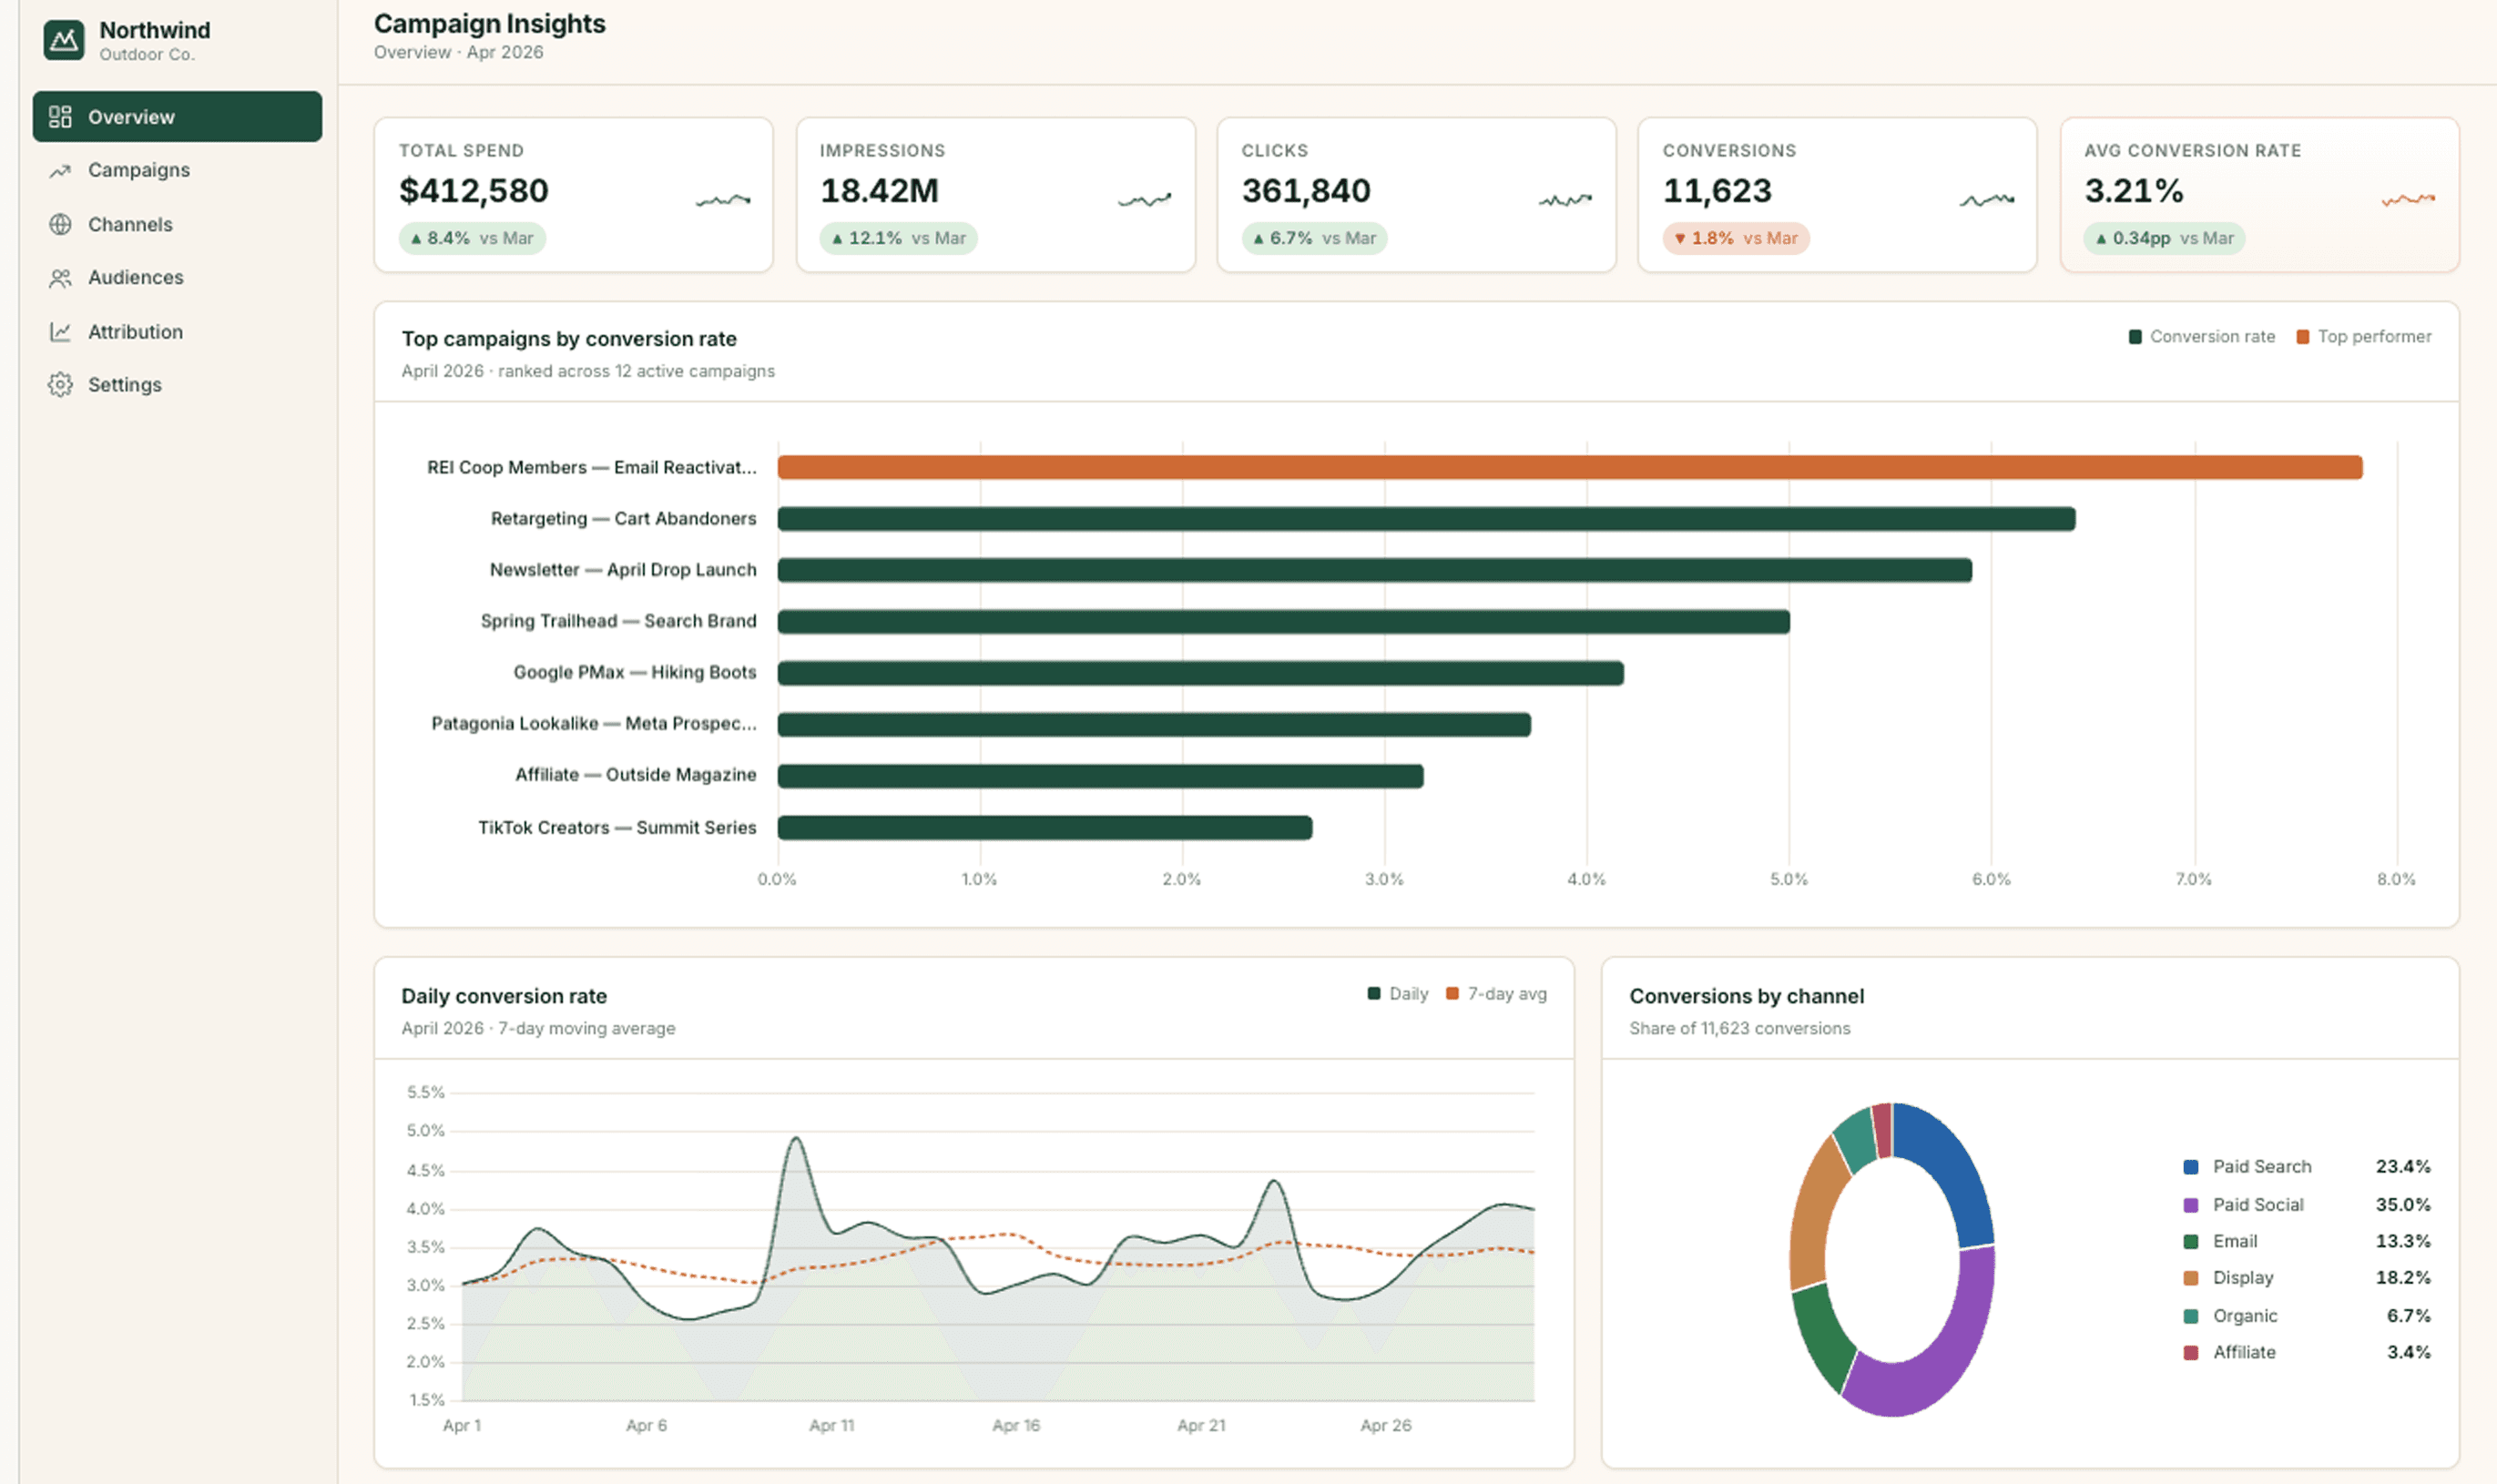
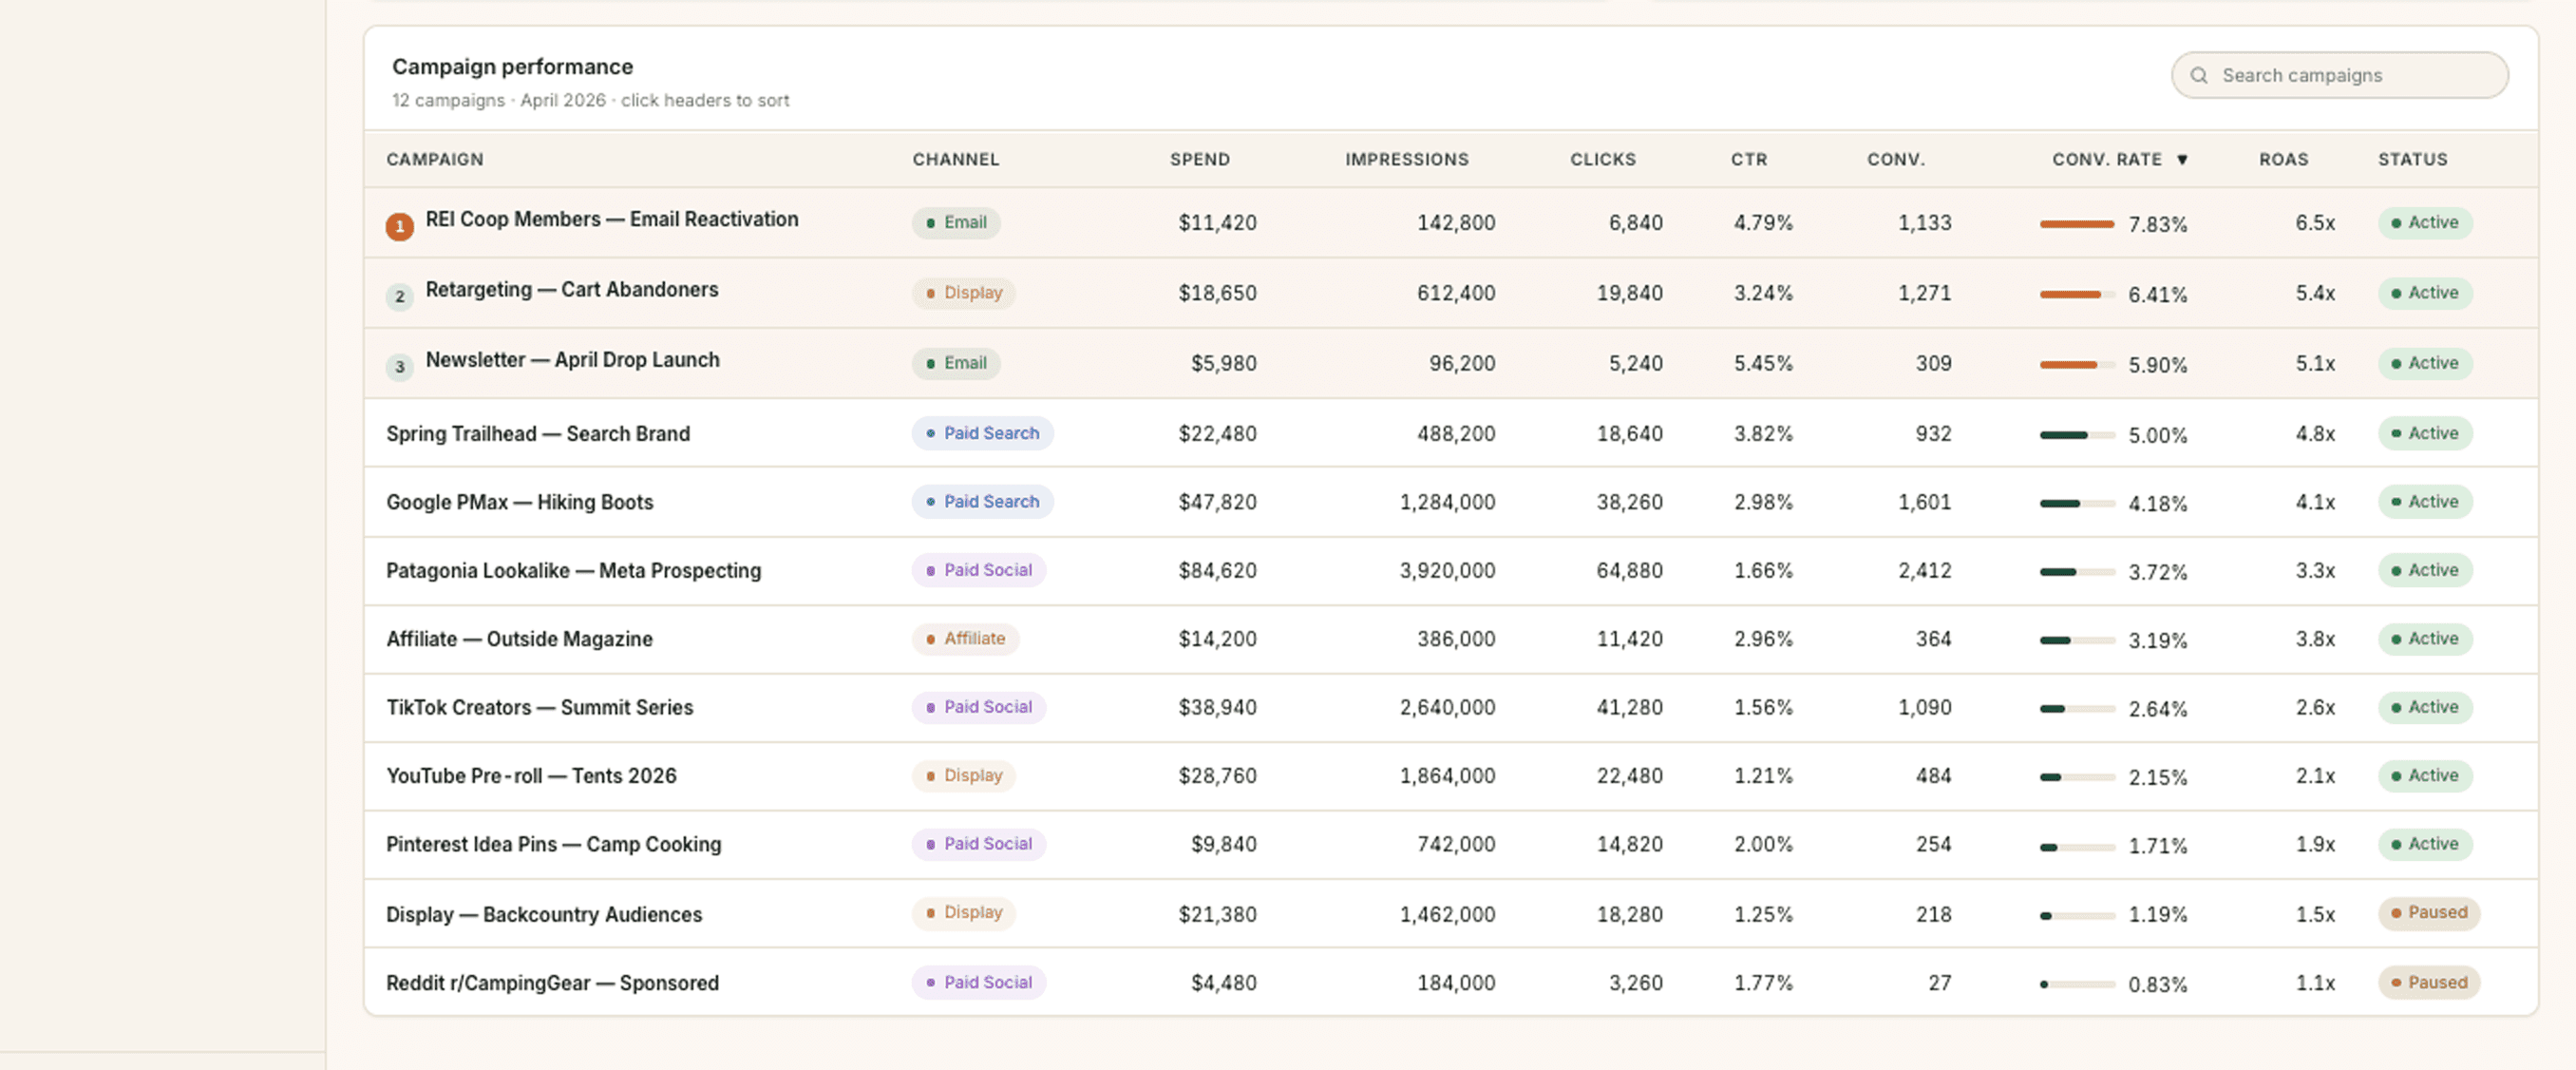
Computer creates a ranked table of campaigns with impressions, clicks, conversions, and calculated conversion rate for the previous calendar month, filtered to only active, in-flight campaigns.

  • A shareable dashboard with:

    • KPI tiles for total conversions, overall conversion rate, and spend for last month, each with period-over-period deltas.

    • A bar chart showing conversion rate by campaign, sortable and filterable by channel, audience, and region.

    • A time series view of daily conversions and conversion rate for top campaigns to reveal performance trends and fatigue.

  • Saved filters or segments (e.g., by platform, device type, funnel stage) so marketers can slice performance and quickly identify high- and low-efficiency campaigns

Tips

  • Make sure your Snowflake schema clearly links campaign metadata, ad impressions or sessions, and conversions so the conversion rate calculation is accurate and consistent across channels.

  • Standardize your date fields and time zones before filtering “last month,” and align on whether you’re using first-touch, last-touch, or another attribution model for counting conversions by campaign.

  • Start with a simple definition of conversion rate (conversions divided by clicks or sessions) and then add views for alternative funnel metrics like click-through rate or cost per conversion once the core dashboard is stable