Key Output
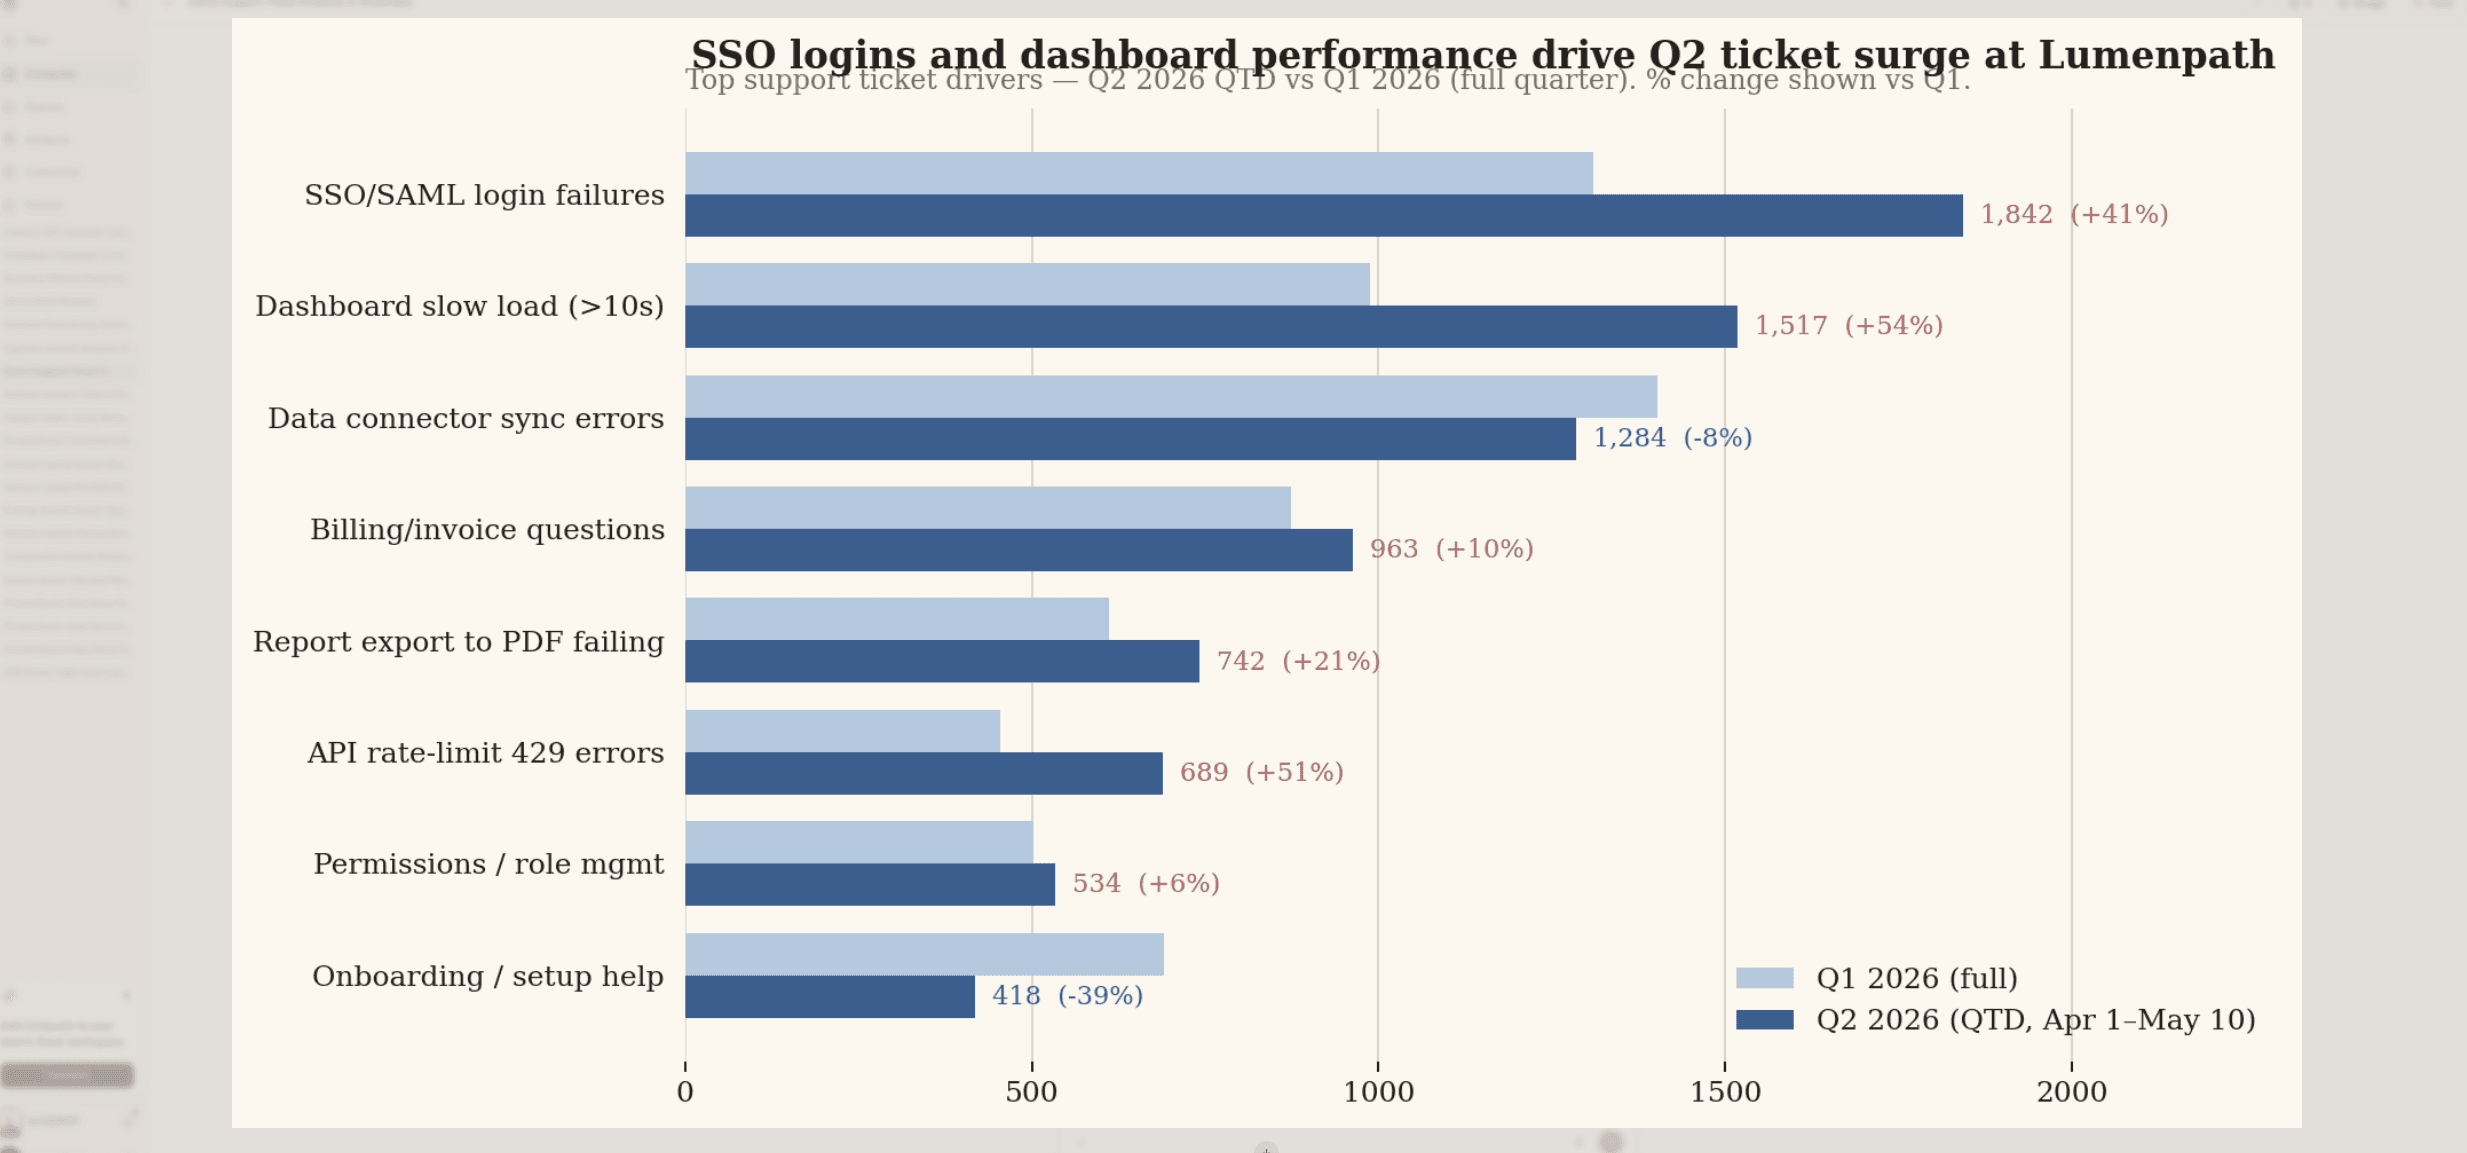
Computer produced a support-ticket driver report that identified the biggest contributors to the quarter-over-quarter ticket increase across product areas and customer segments.
The Summary section provides a dashboard with KPI cards for total tickets, quarter-over-quarter change, top product areas, affected customer segments, and highest-priority follow-ups so you can quickly understand where the spike is coming from.
The Driver Breakdown section is the full table of issue drivers sorted by contribution to the increase, with product area, customer segment, current-quarter tickets, prior-quarter tickets, absolute change, percentage change, share of total increase, confidence note, and suggested owner.
The Trend section shows weekly ticket volume by top product area and customer segment, useful for seeing whether the change was a steady rise, a one-week spike, or a pattern tied to a launch or incident.
Computer also applied a four-part action framework: investigate now (high-volume issues with large recent increases), monitor closely (growing issues that are not yet the largest drivers), clean up data (categories with missing or inconsistent labels), and deprioritize (low-volume changes that look noisy or isolated).

Tips
Specify the ticket definitions you care about: The default analysis can include all support tickets, but you can narrow it by saying “exclude internal test tickets, bot-generated tickets, and tickets tagged as billing.”
Add downstream context: Follow up with “turn this into a VP-ready summary for the weekly product review” or “draft follow-up questions for the product owners of the top three drivers.”
Layer in additional filters: Add constraints like “only include enterprise customers,” “compare paid versus trial accounts,” or “focus on tickets opened after the latest release.”