Create a marketing intelligence command center

Create a marketing intelligence command center

Create a marketing intelligence command center

Deep Research

Deep Research

Apps & files

Apps & files

Premium sources

Premium sources

Marketing

Marketing

Overview

Overview

Overview

Computer can transform raw cross-platform ad exports into a unified marketing command center that shows where your pipeline truly comes from and how every incremental dollar should be allocated. It normalizes Google, Meta, and LinkedIn data into a single full‑funnel view, layers on competitive intel, and delivers an interactive dashboard with budget sliders, overlap analysis, and tactical next actions your team can execute immediately.

Computer can transform raw cross-platform ad exports into a unified marketing command center that shows where your pipeline truly comes from and how every incremental dollar should be allocated. It normalizes Google, Meta, and LinkedIn data into a single full‑funnel view, layers on competitive intel, and delivers an interactive dashboard with budget sliders, overlap analysis, and tactical next actions your team can execute immediately.

Computer can transform raw cross-platform ad exports into a unified marketing command center that shows where your pipeline truly comes from and how every incremental dollar should be allocated. It normalizes Google, Meta, and LinkedIn data into a single full‑funnel view, layers on competitive intel, and delivers an interactive dashboard with budget sliders, overlap analysis, and tactical next actions your team can execute immediately.

Query:

Query:

Query:

I'm the Head of Performance Marketing at Zenith SaaS. I'm uploading our February ad performance data across all three platforms — Google ($133K), Meta ($67K), and LinkedIn ($65K). Total spend: $265K. I need a comprehensive marketing intelligence analysis: Cross-platform performance analysis: Unify the metrics across platforms (different attribution models, different conversion definitions). Which platform is actually driving the most efficient pipeline? Don't just look at CPA — look at the full funnel: impression → click → lead → trial → paid. Audience overlap analysis: Are we targeting the same people across platforms and bidding against ourselves? Where are the unique audiences on each platform? Creative & messaging analysis: Which ad types, formats, and messages perform best? Is there a pattern across platforms? Budget optimization: If I could only spend $200K next month (budget cut), how should I reallocate? If I got $350K (budget increase), where should the incremental dollar go? Build a marginal efficiency curve. Competitive intelligence: Research what our competitors (Datadog, HubSpot, Monday.com, Notion) are doing in paid media. What keywords are they bidding on? What does their ad creative look like? Recommendations: Give me 10 specific, tactical optimizations I can implement this week — not vague "test more creative" advice, but specific actions like "pause campaign X, increase bid on keyword Y, shift $Z from LinkedIn to Meta retargeting." Deploy a marketing command center dashboard — cross-platform unified view, budget allocator with drag-to-reallocate, campaign-level drill-down, and the marginal efficiency curve.

I'm the Head of Performance Marketing at Zenith SaaS. I'm uploading our February ad performance data across all three platforms — Google ($133K), Meta ($67K), and LinkedIn ($65K). Total spend: $265K. I need a comprehensive marketing intelligence analysis: Cross-platform performance analysis: Unify the metrics across platforms (different attribution models, different conversion definitions). Which platform is actually driving the most efficient pipeline? Don't just look at CPA — look at the full funnel: impression → click → lead → trial → paid. Audience overlap analysis: Are we targeting the same people across platforms and bidding against ourselves? Where are the unique audiences on each platform? Creative & messaging analysis: Which ad types, formats, and messages perform best? Is there a pattern across platforms? Budget optimization: If I could only spend $200K next month (budget cut), how should I reallocate? If I got $350K (budget increase), where should the incremental dollar go? Build a marginal efficiency curve. Competitive intelligence: Research what our competitors (Datadog, HubSpot, Monday.com, Notion) are doing in paid media. What keywords are they bidding on? What does their ad creative look like? Recommendations: Give me 10 specific, tactical optimizations I can implement this week — not vague "test more creative" advice, but specific actions like "pause campaign X, increase bid on keyword Y, shift $Z from LinkedIn to Meta retargeting." Deploy a marketing command center dashboard — cross-platform unified view, budget allocator with drag-to-reallocate, campaign-level drill-down, and the marginal efficiency curve.

Key output

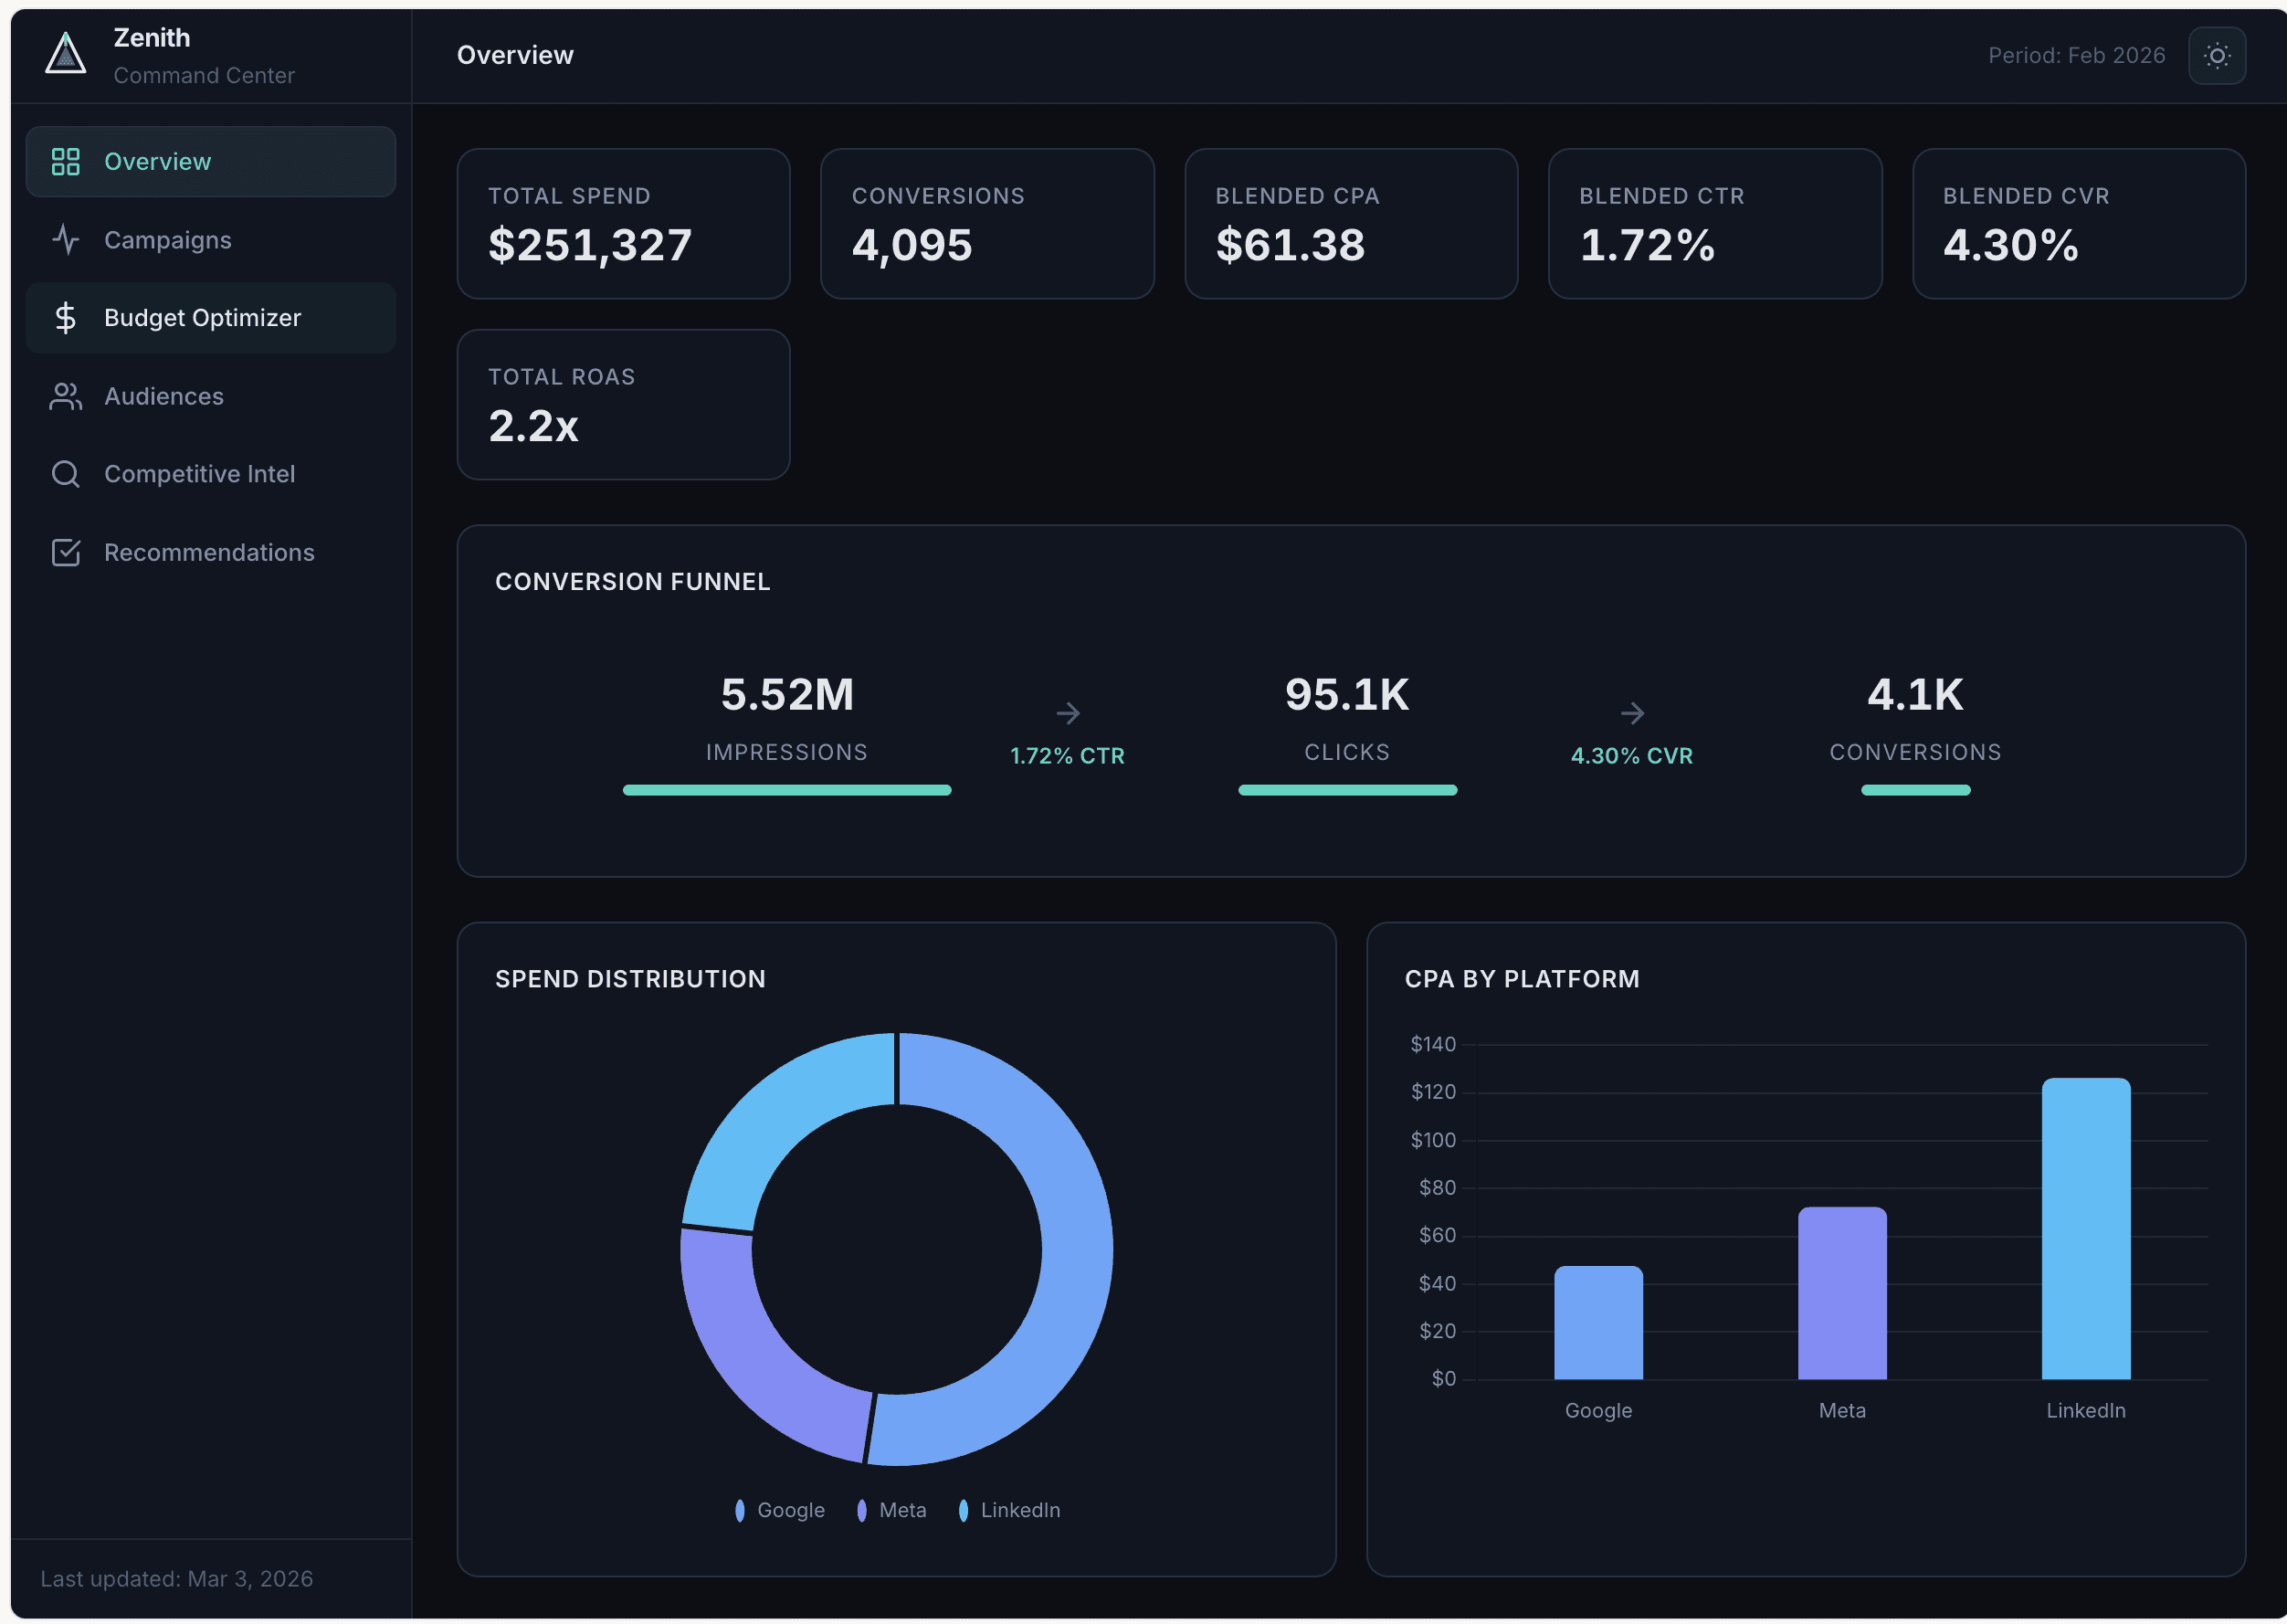
Computer ingested your February Google, Meta, and LinkedIn exports, normalized conversion definitions and attribution windows, and built a full‑funnel view from impression to paid user for each platform.

It surfaced Google as the core pipeline driver with the lowest blended CPA and strongest ROAS, Meta as the high‑leverage retargeting and trial engine, and LinkedIn as the expensive but high‑intent enterprise channel with the best click‑to‑lead rate. It then identified four underperforming campaigns (each with CPAs above $160 and sub‑1x ROAS) that were dragging down blended efficiency and recommended pausing them to reduce wasted spend.

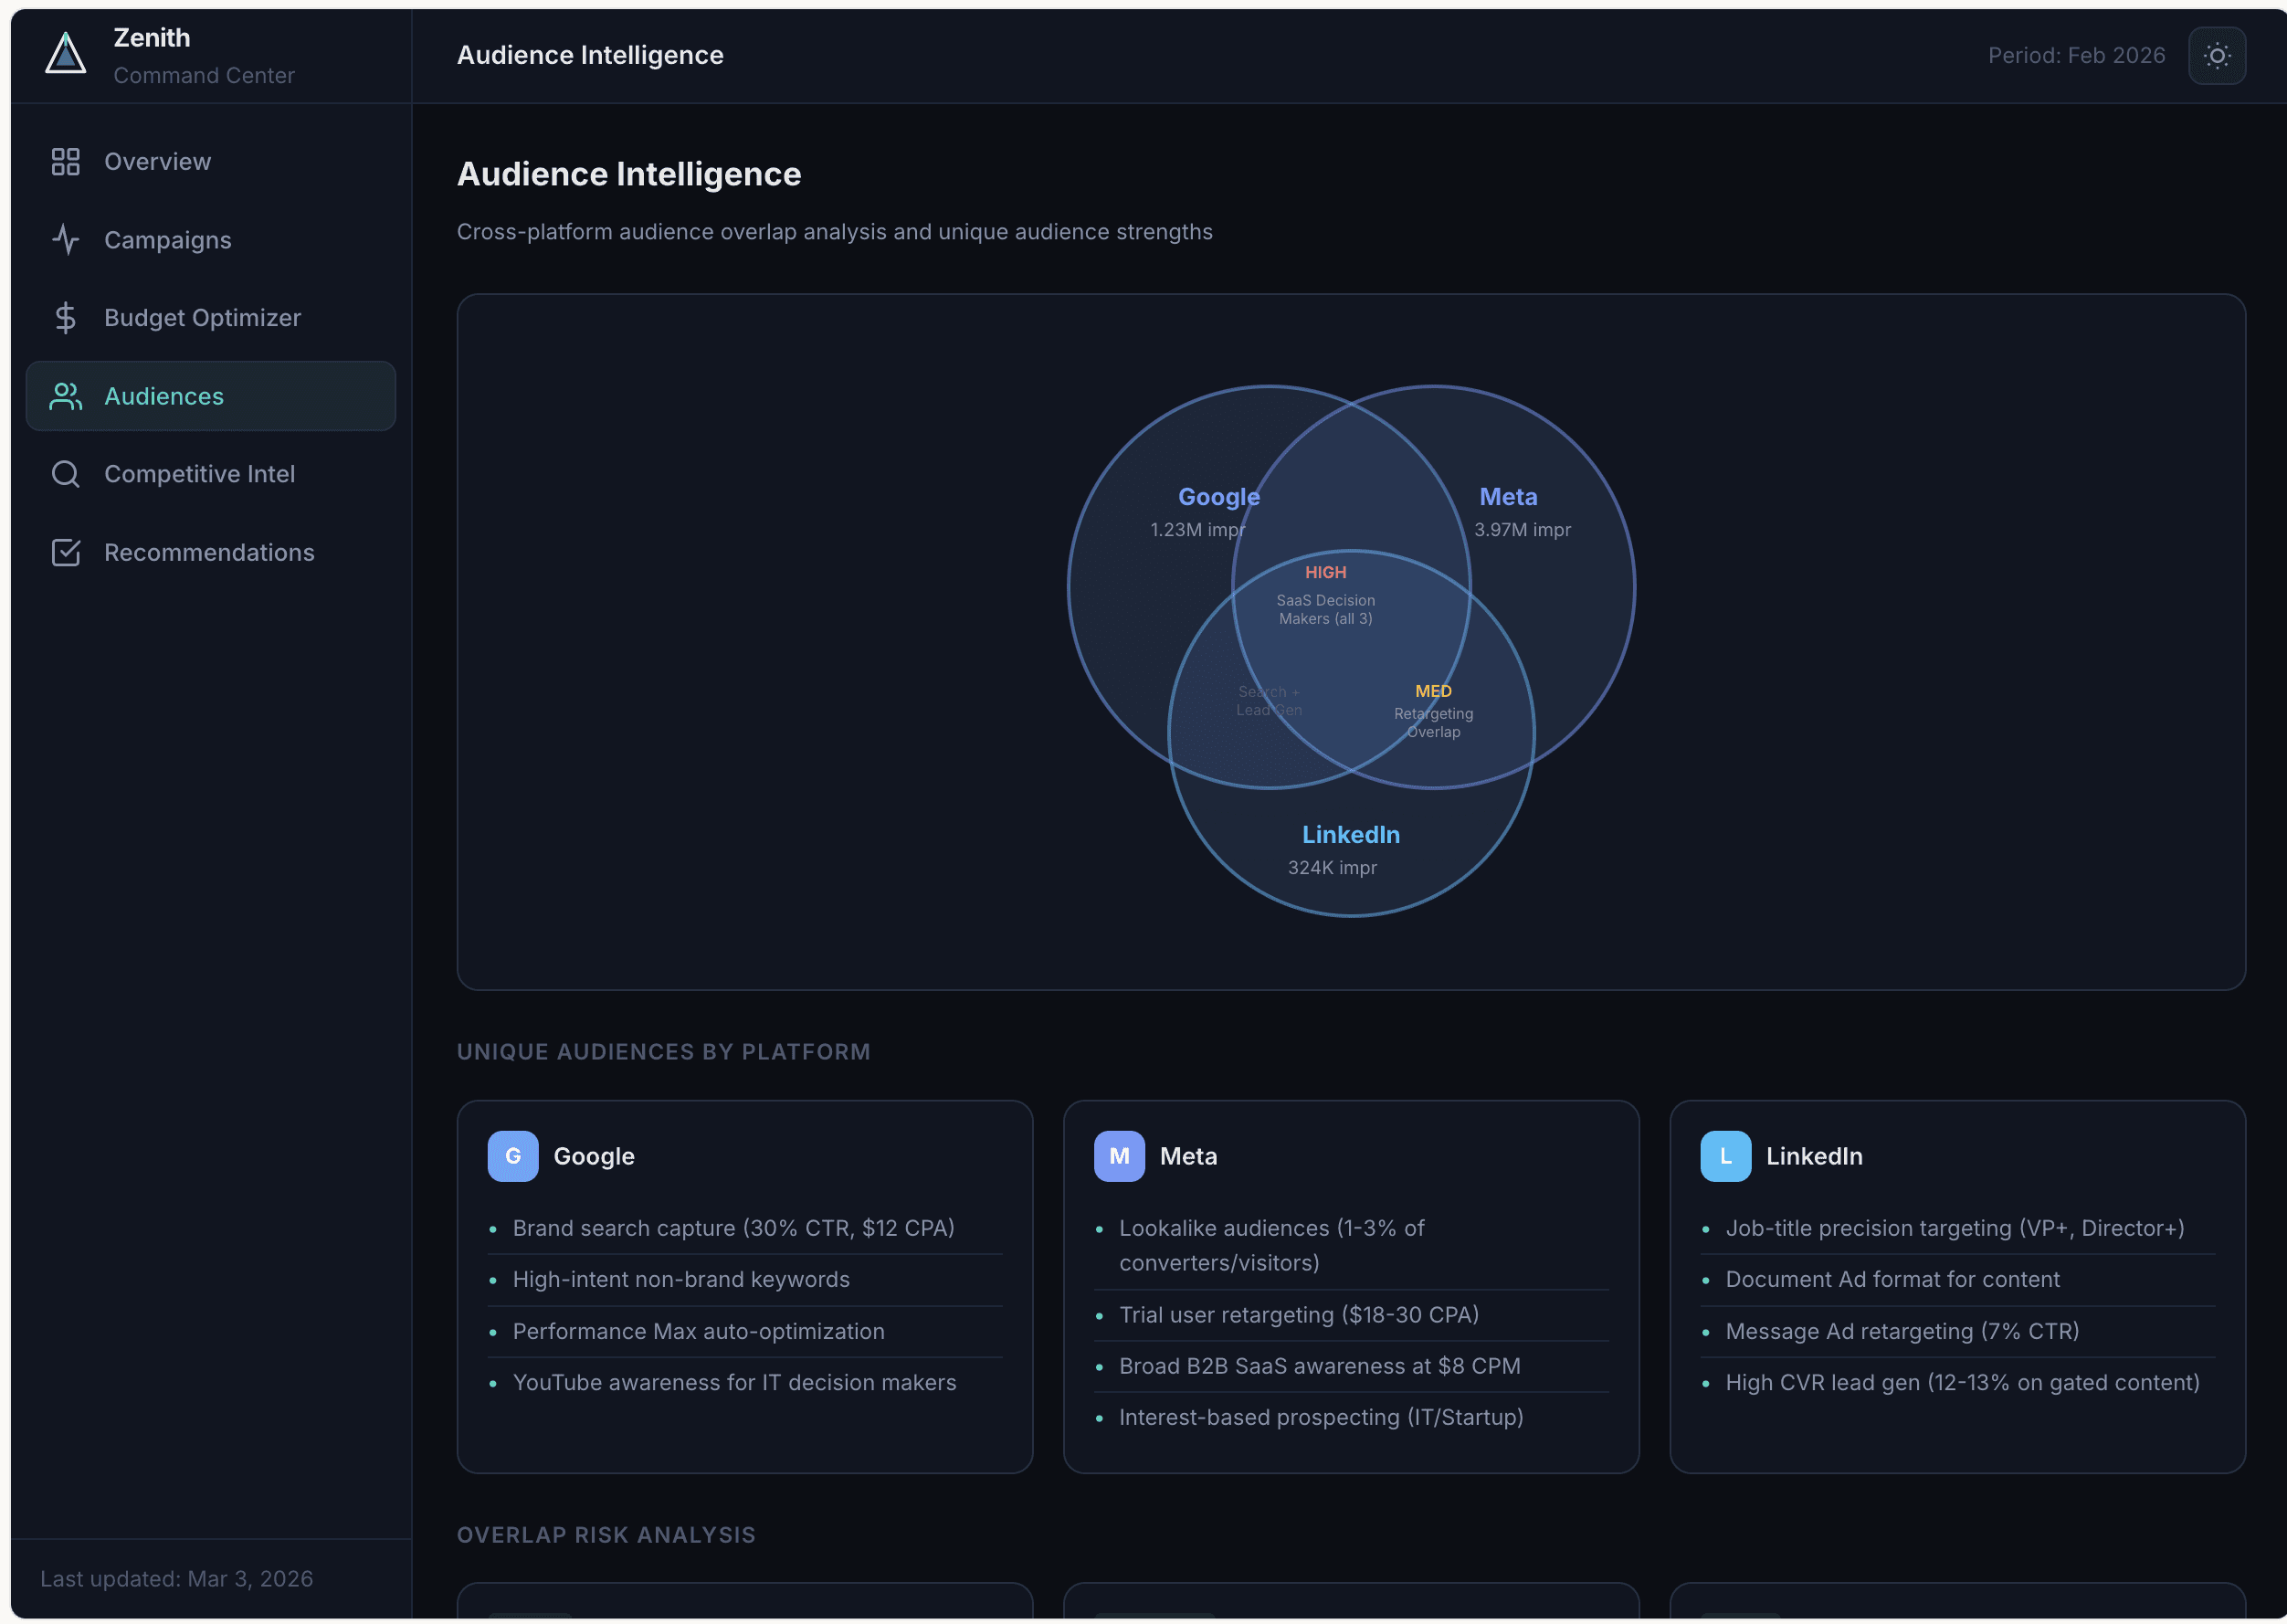
Using audience definitions and pixel data, Computer mapped where Zenith is bidding against itself on overlapping SaaS decision‑maker segments across Google, Meta, and LinkedIn, while also highlighting three uniquely valuable audiences: Google brand search, Meta 1% lookalikes, and LinkedIn ABM named accounts.

It analyzed creative and messaging patterns to flag which formats and value props consistently win across platforms, then built two budget scenarios — a $200K cut and a $350K increase — with a marginal efficiency curve showing where incremental dollars earn the best CPA and ROAS.

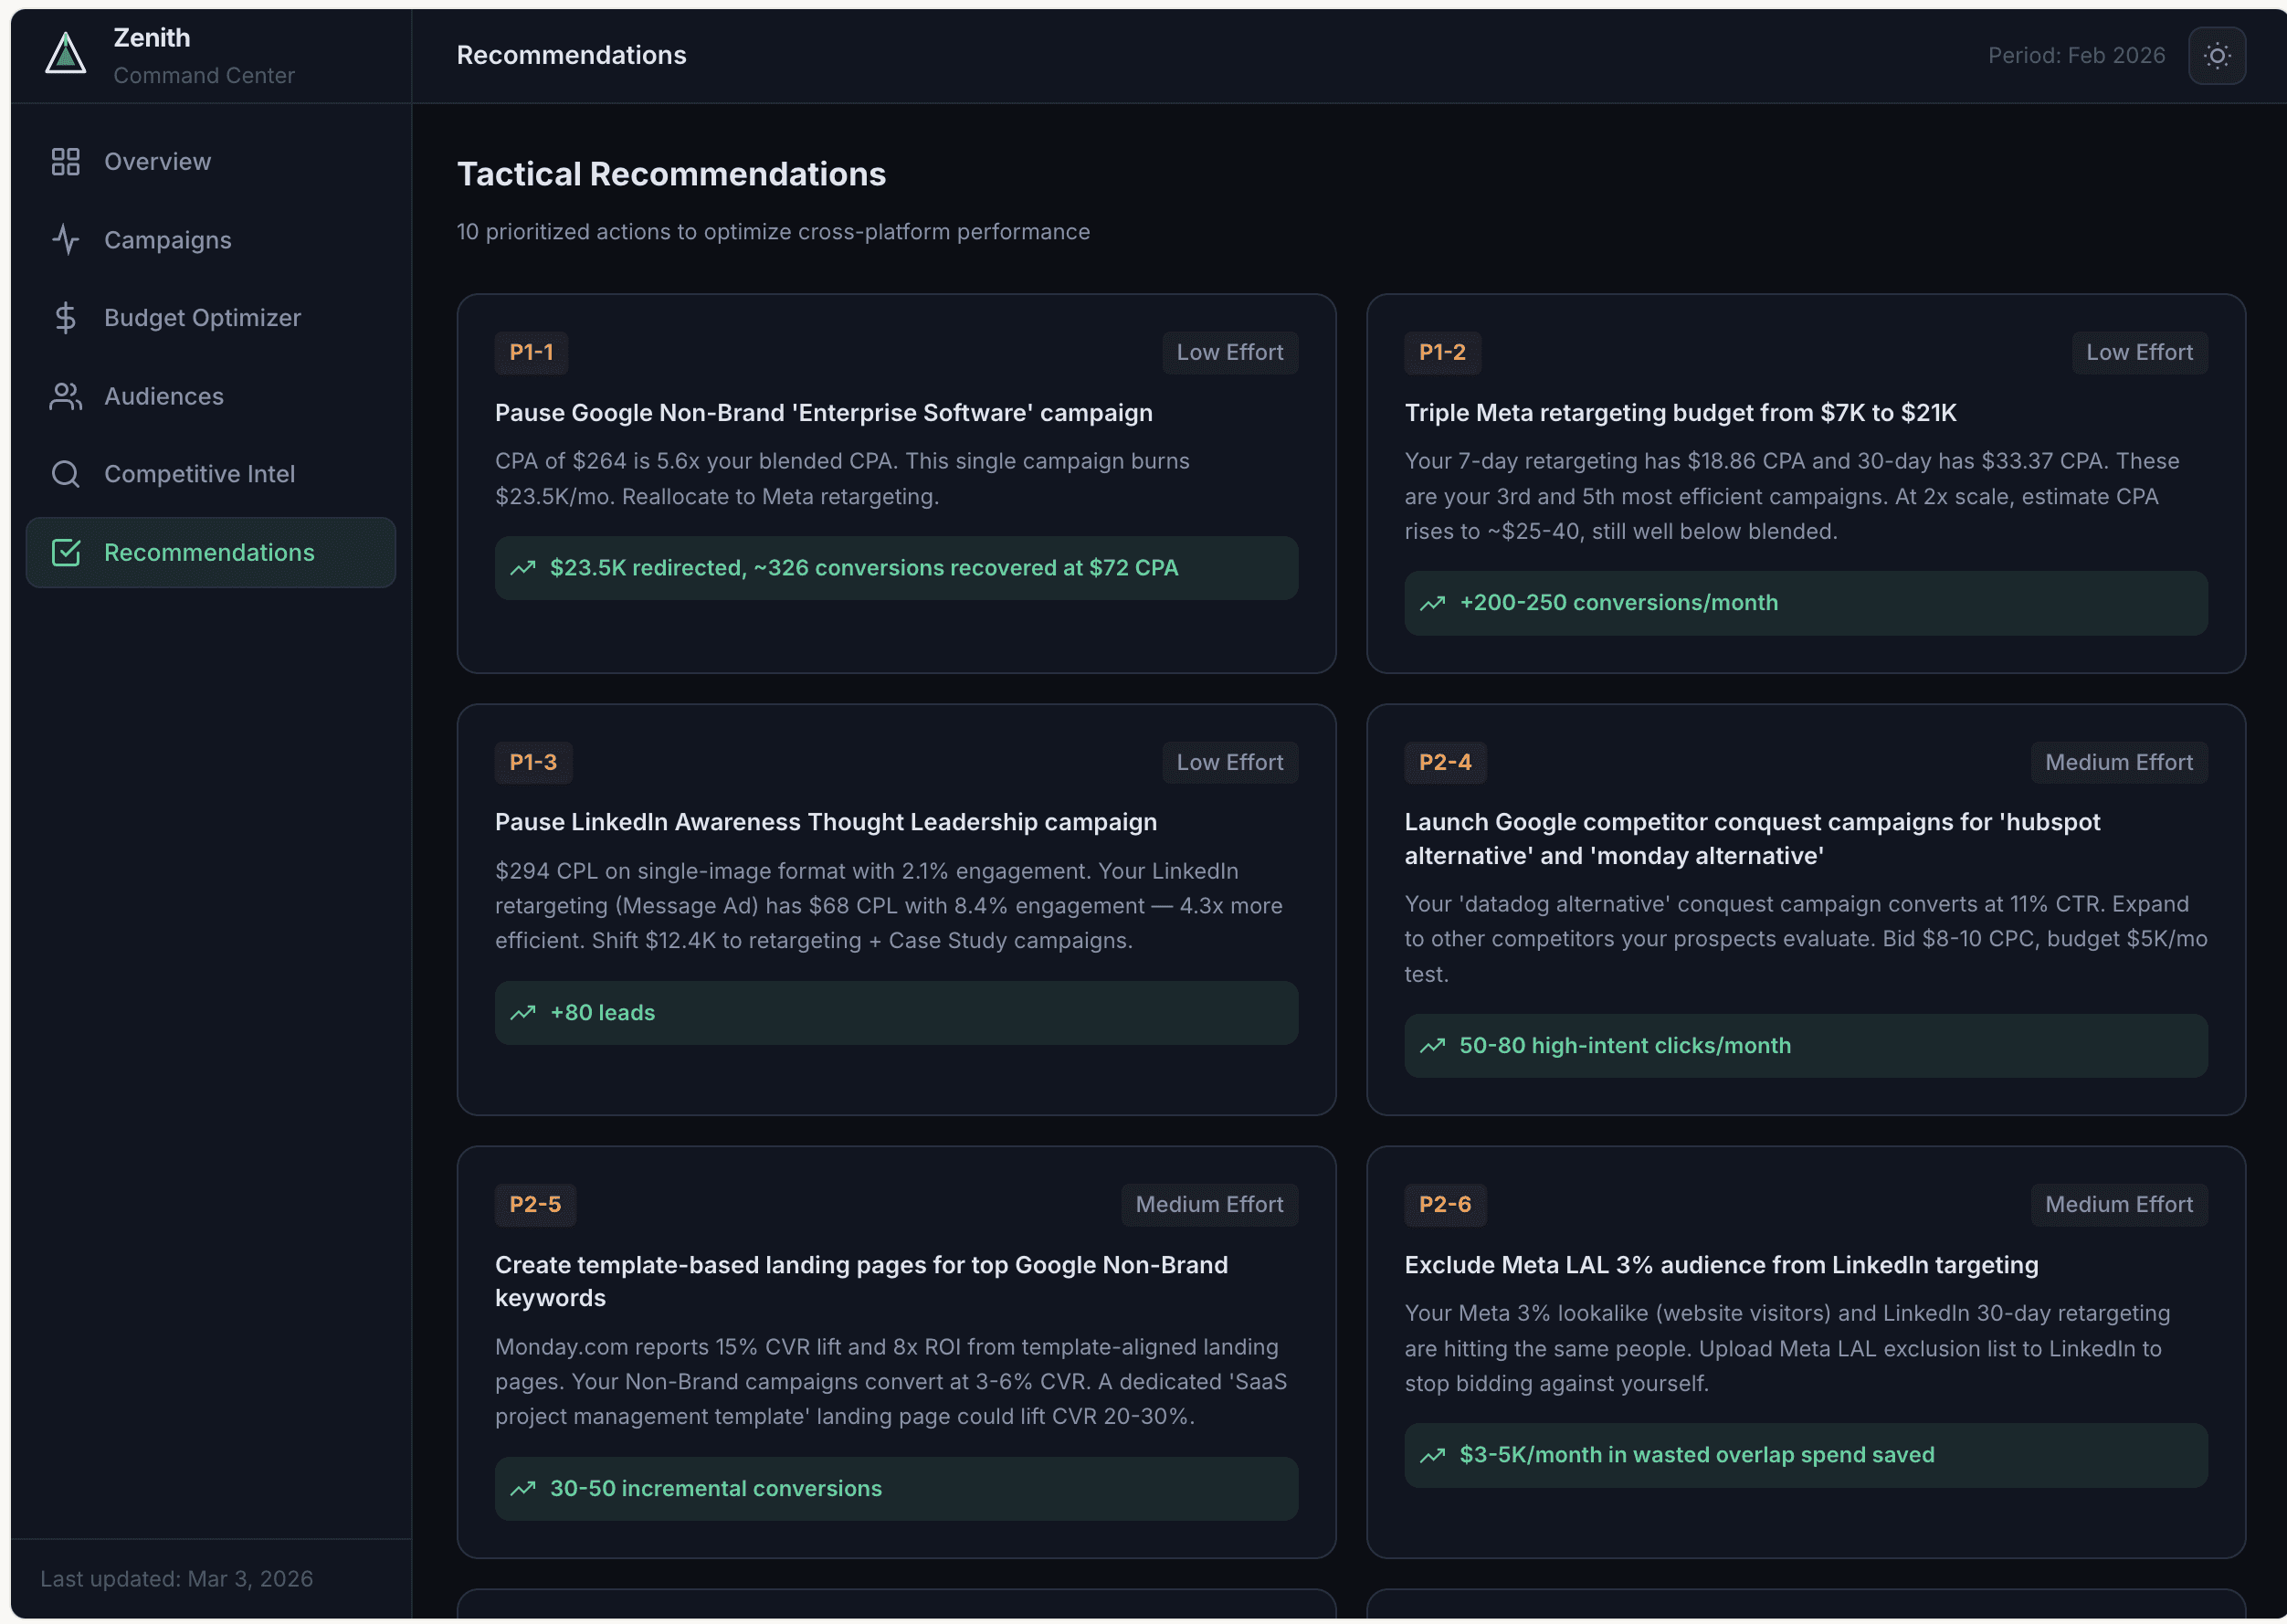
Competitive intel cards for Datadog, HubSpot, Monday.com, and Notion summarize their spend posture, keyword themes, and ad angles, and Computer distilled everything into 10 concrete P1–P3 actions (pause specific campaigns, 3x Meta retargeting, launch named conquest keywords, shift budget between channels). All of this is deployed as a responsive marketing command center with an overview tab, campaign drill‑down, budget optimizer sliders, audience overlap view, competitive intel, and a prioritized recommendations tab you can run your weekly performance meeting from.
Tips

  • Lock in funnel definitions – Tell Computer exactly how to define each stage, for example: “Treat trials started within 7 days of first click as conversions; exclude view‑through conversions from efficiency metrics.”

  • Constrain competitors and geos – Focus the intel where it matters, for example: “Prioritize US/UK search for ‘SaaS analytics’ competitors and ignore SMB‑only tools.”

  • Align recommendations to your sprint cadence – Tie actions to planning, for example: “Group recommendations into ‘Do today’, ‘This sprint’, and ‘Next month’ so I can drop them straight into our Jira board.”