Key Output
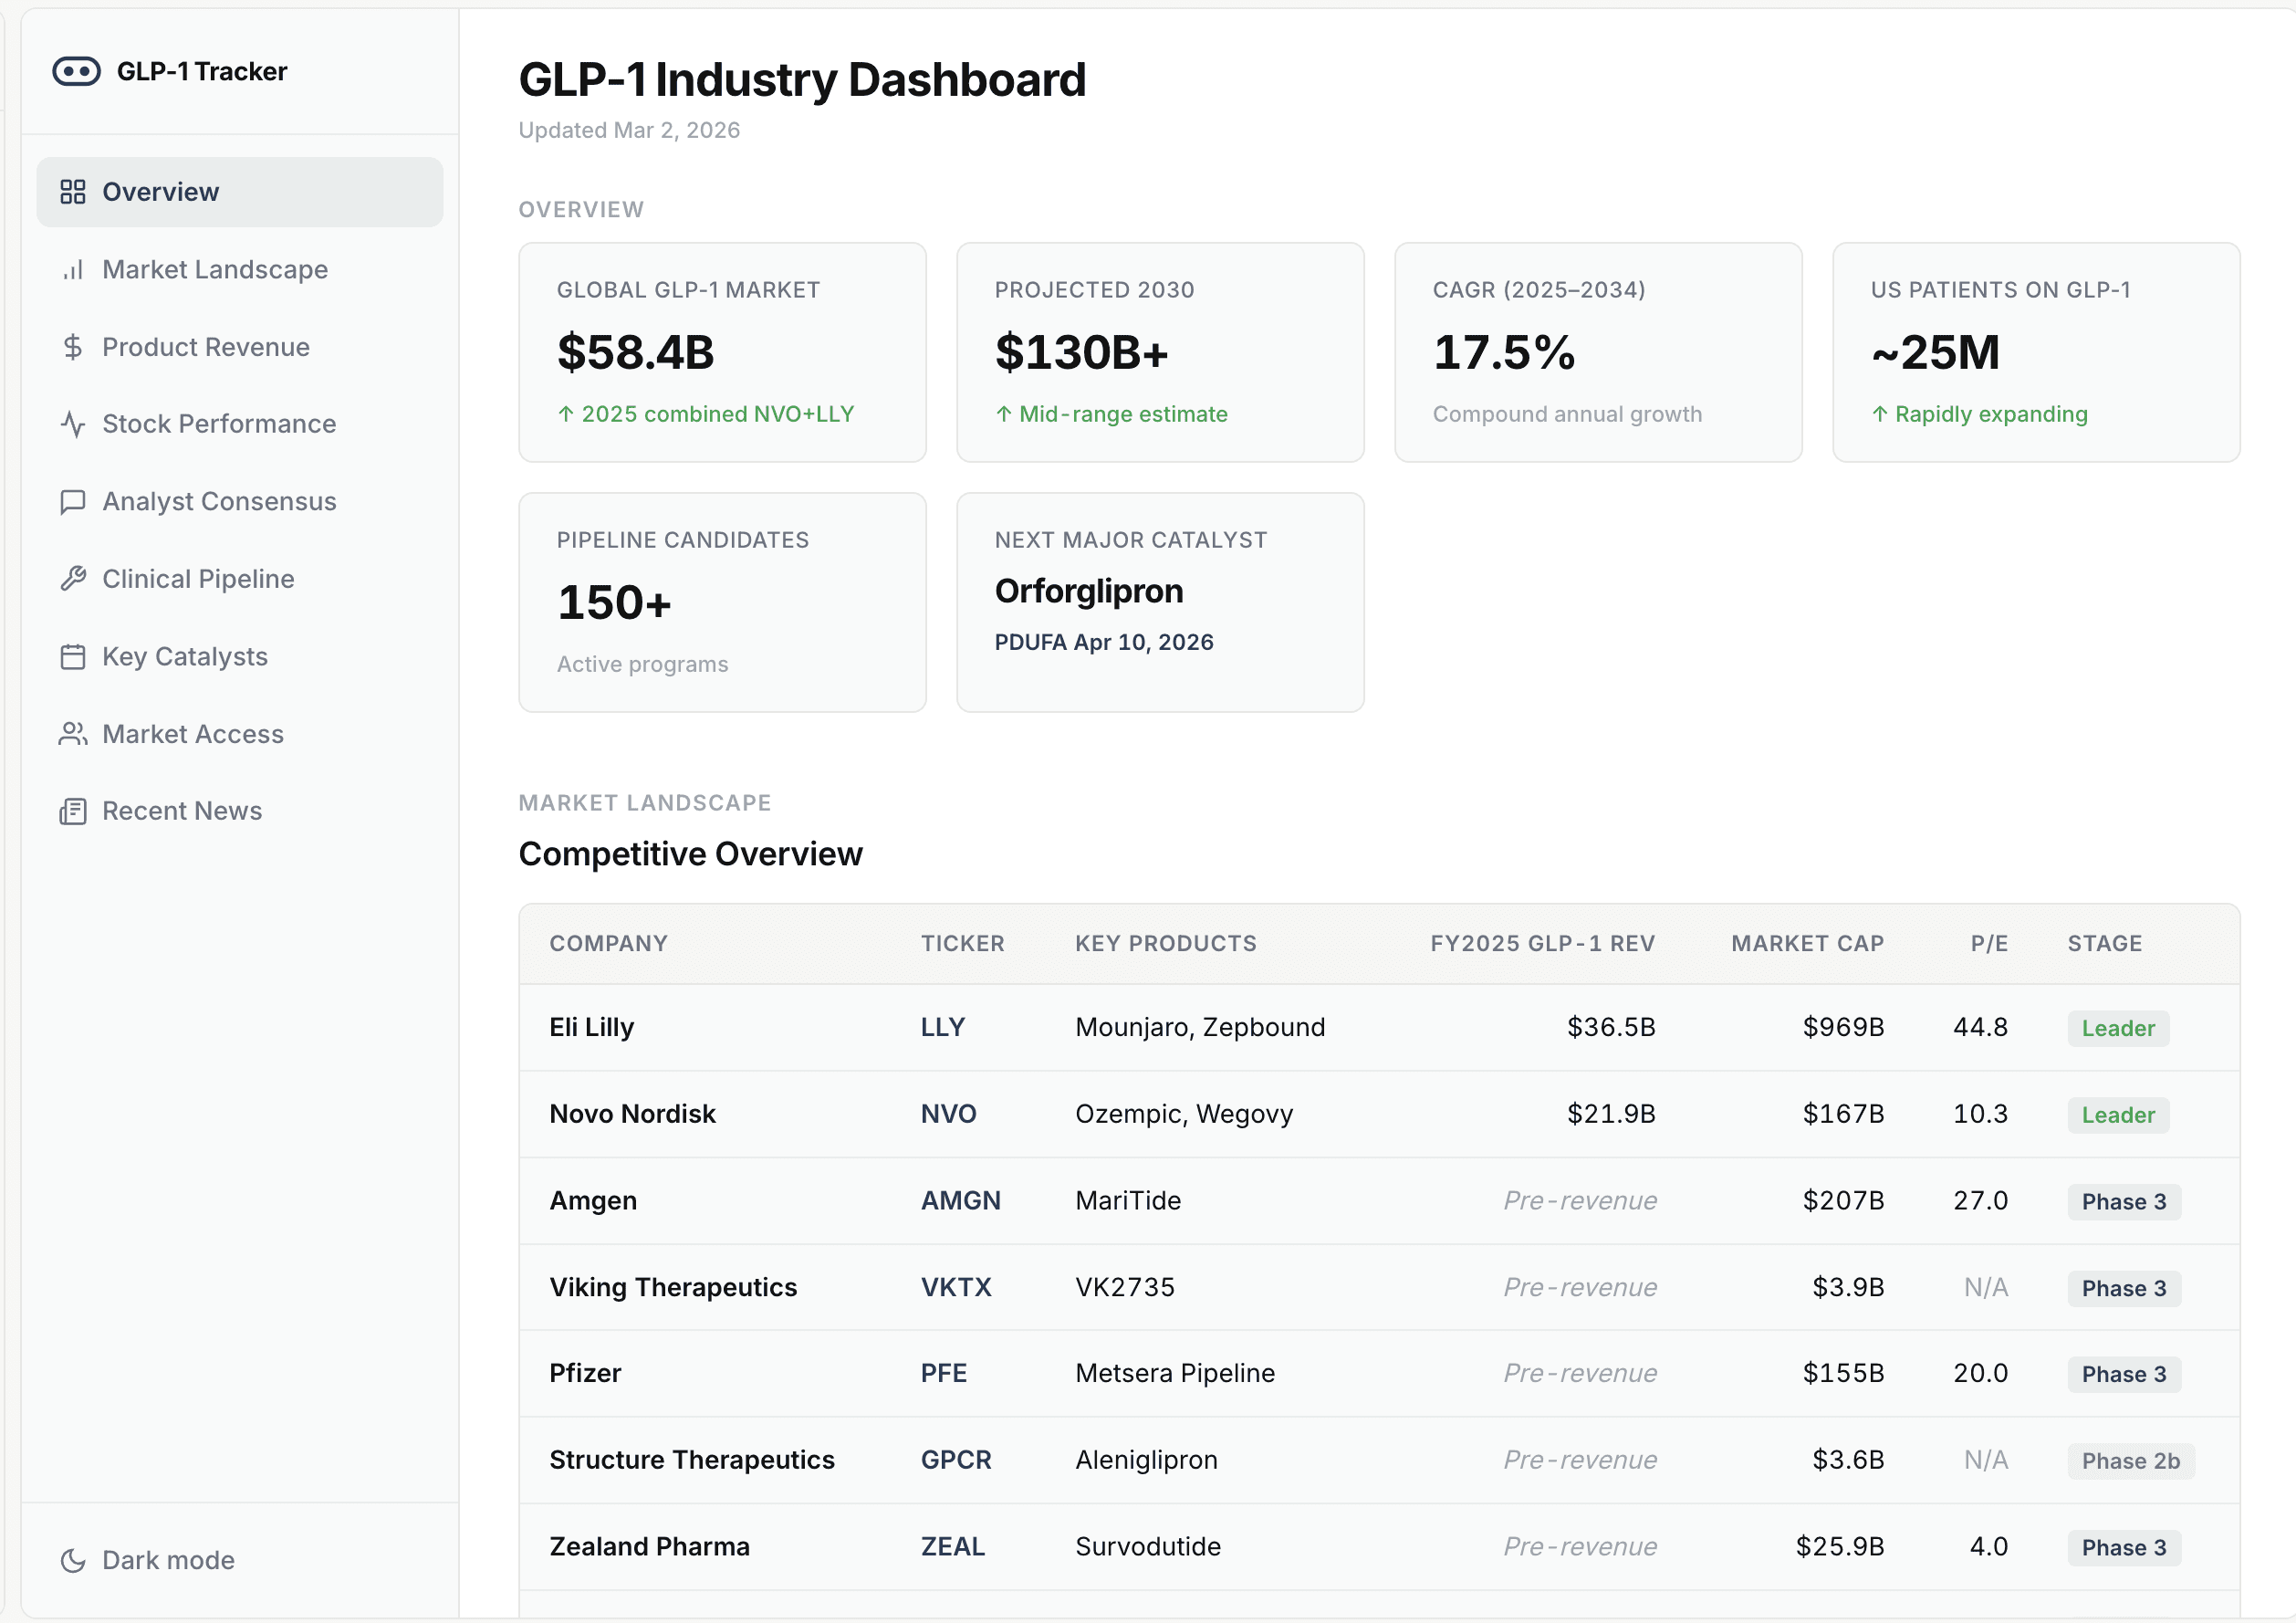
Computer began by conducting parallel web searches across financial news (CNBC, Reuters, Yahoo Finance), market research reports (J.P. Morgan, IQVIA), clinical trial databases (Clinical Trials Arena, Prime Therapeutics), and company filings to compile a comprehensive dataset covering market sizing, company financials, drug pipeline status, approved indications, safety profiles, and research activity.
It then designed and built a single-page web application using HTML, CSS, and Chart.js with an enterprise-SaaS aesthetic — white and gray surfaces with minimal teal accent color. The dashboard features six navigable sections accessed via sidebar: Market Overview with KPI cards and market trajectory charts, Key Players with detailed Novo Nordisk and Eli Lilly financials, Drug Pipeline with a phase-stage tracker table, Clinical Indications showing approved and investigational uses, Safety & Access covering side effects and regulatory timelines, and Research & Trials with geographic distribution and upcoming catalysts.
All data is sourced and cited with linked references throughout.
Tips
Specify the sections and data dimensions you care about: Add "include a pipeline tracker by development phase, market share visualization between Novo Nordisk and Eli Lilly, and a regulatory timeline for Medicare coverage" so the dashboard maps to your actual information needs rather than generic industry summaries
Request a specific visual style upfront: Include "enterprise-SaaS aesthetic with light white/gray tones and minimal color" or reference a dashboard you like — this prevents Computer from defaulting to generic or overly colorful designs and ensures the output matches your professional context
Ask for source citations throughout: Add "cite all data points with linked sources from financial filings, analyst reports, and clinical databases" to ensure every metric is verifiable — critical for investor-facing or research-grade outputs where data provenance matters