Key Output
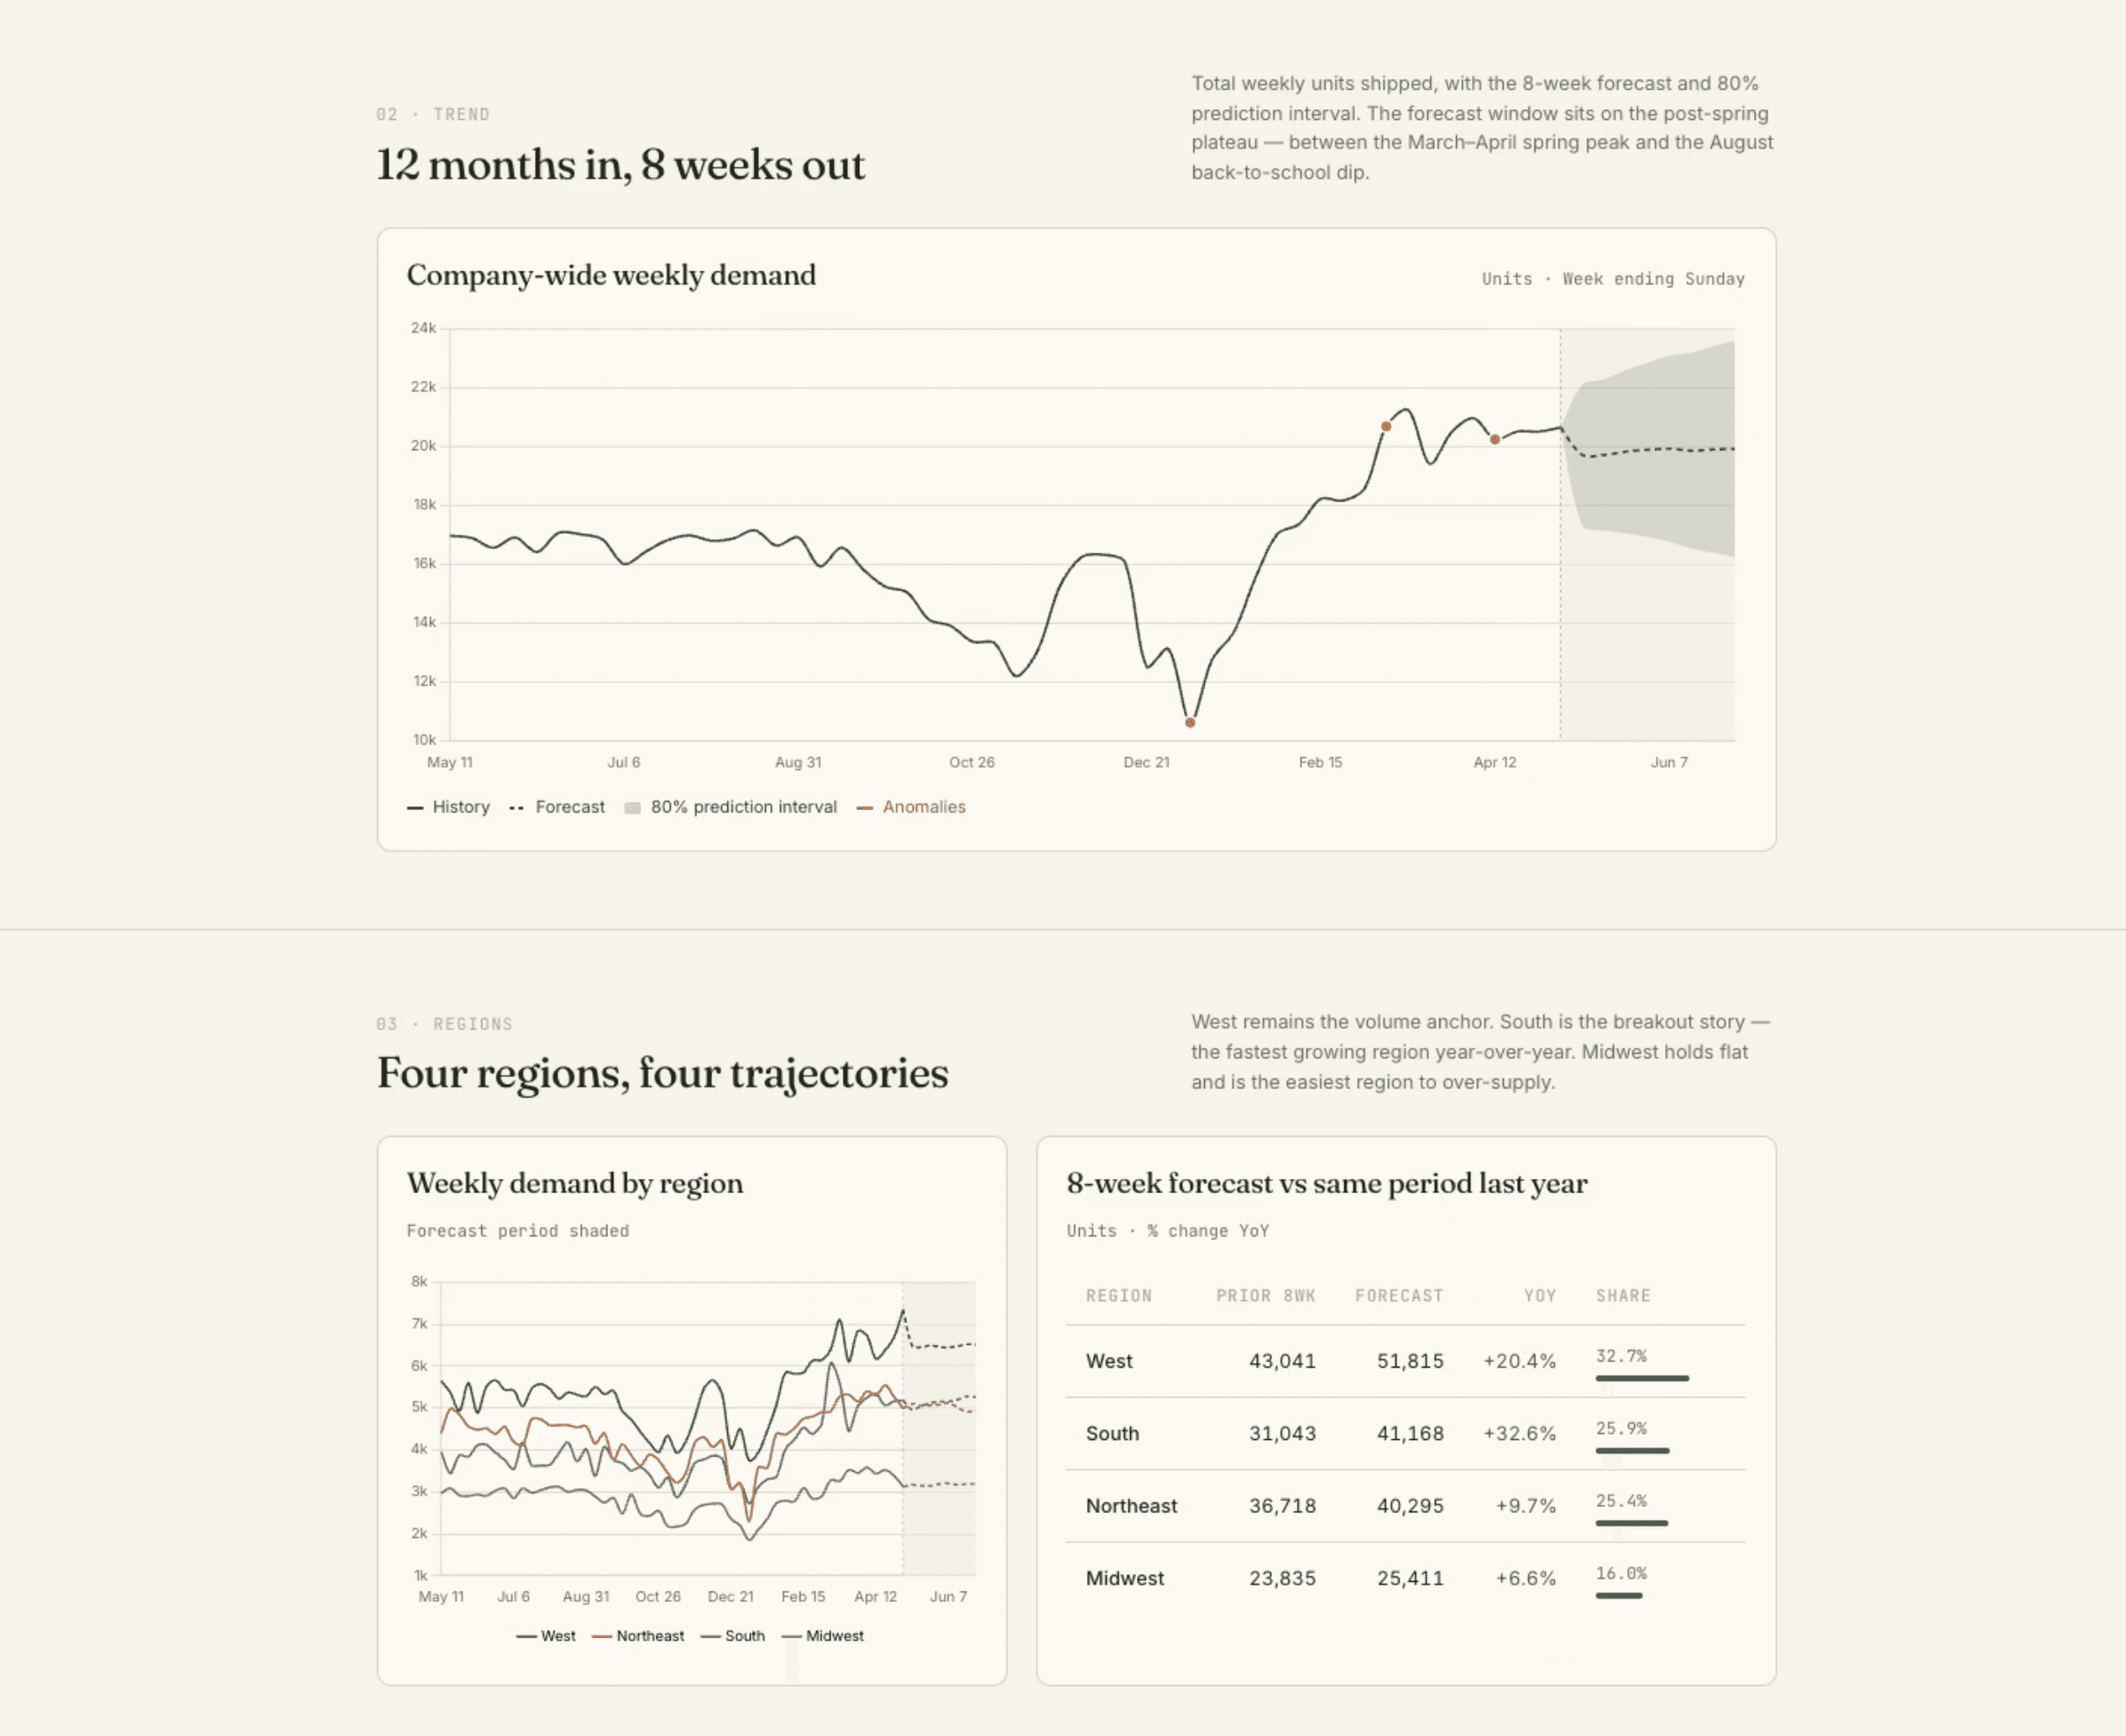
Computer produced an eight-week demand forecast with weekly estimates by region and customer segment based on the last 12 months of warehouse history.
The Summary section provides a dashboard with expected demand, highest-growth regions, segments with declining or uncertain demand, known anomalies, and recommended planning assumptions so you can quickly understand the forecast before reviewing the details.
The Forecast Table section shows week, region, customer segment, historical baseline, forecasted demand, low estimate, high estimate, main assumption, and reliability note. It is structured so the table can be pasted into a planning doc or spreadsheet.
The Trend section compares historical actuals with the forecast, with callouts for unusual weeks, seasonality, and segments where the data is too sparse to read confidently.
Computer also applied a four-part planning framework: plan around (segments with enough history and a stable trend), watch closely (segments with growth but wider uncertainty), investigate first (segments affected by anomalies or missing data), and do not over-read (low-volume segments where percentage changes are noisy).

Tips
Define what demand means: If your team uses a specific metric, say “forecast API calls,” “forecast bookings,” “forecast support volume,” or “forecast seat expansion” instead of just “demand.”
Add planning context: Follow up with “turn this into a staffing recommendation” or “summarize the forecast for the weekly operating review.”
Layer in known events: Add filters or context like “exclude the outage week,” “account for the March pricing change,” or “compare against last year’s holiday period.”