Create an Excel file analysis of company financials

Create an Excel file analysis of company financials

Create an Excel file analysis of company financials

Business

Business

Finance

Finance

Canvas

Canvas

AI your team can trust to do the work

AI your team can trust to do the work

AI your team can trust to do the work

Get accurate, cited research and then turn those insights into finished projects, all on one secure platform.

Get accurate, cited research and then turn those insights into finished projects, all on one secure platform.

Overview

Overview

Overview

Perplexity can generate a complete, multi-sheet Excel workbook that analyzes capital expenditures and free cash flow over the past five fiscal years, while also surfacing strategic insights tied to trends like AI infrastructure spending.

Perplexity can generate a complete, multi-sheet Excel workbook that analyzes capital expenditures and free cash flow over the past five fiscal years, while also surfacing strategic insights tied to trends like AI infrastructure spending.

Perplexity can generate a complete, multi-sheet Excel workbook that analyzes capital expenditures and free cash flow over the past five fiscal years, while also surfacing strategic insights tied to trends like AI infrastructure spending.

Query:

Query:

Query:

Create an excel that analyzes and compares the CapEx to FCF of the MAG 7 tech companies over the past five fiscal years.

Create an excel that analyzes and compares the CapEx to FCF of the MAG 7 tech companies over the past five fiscal years.

Your search

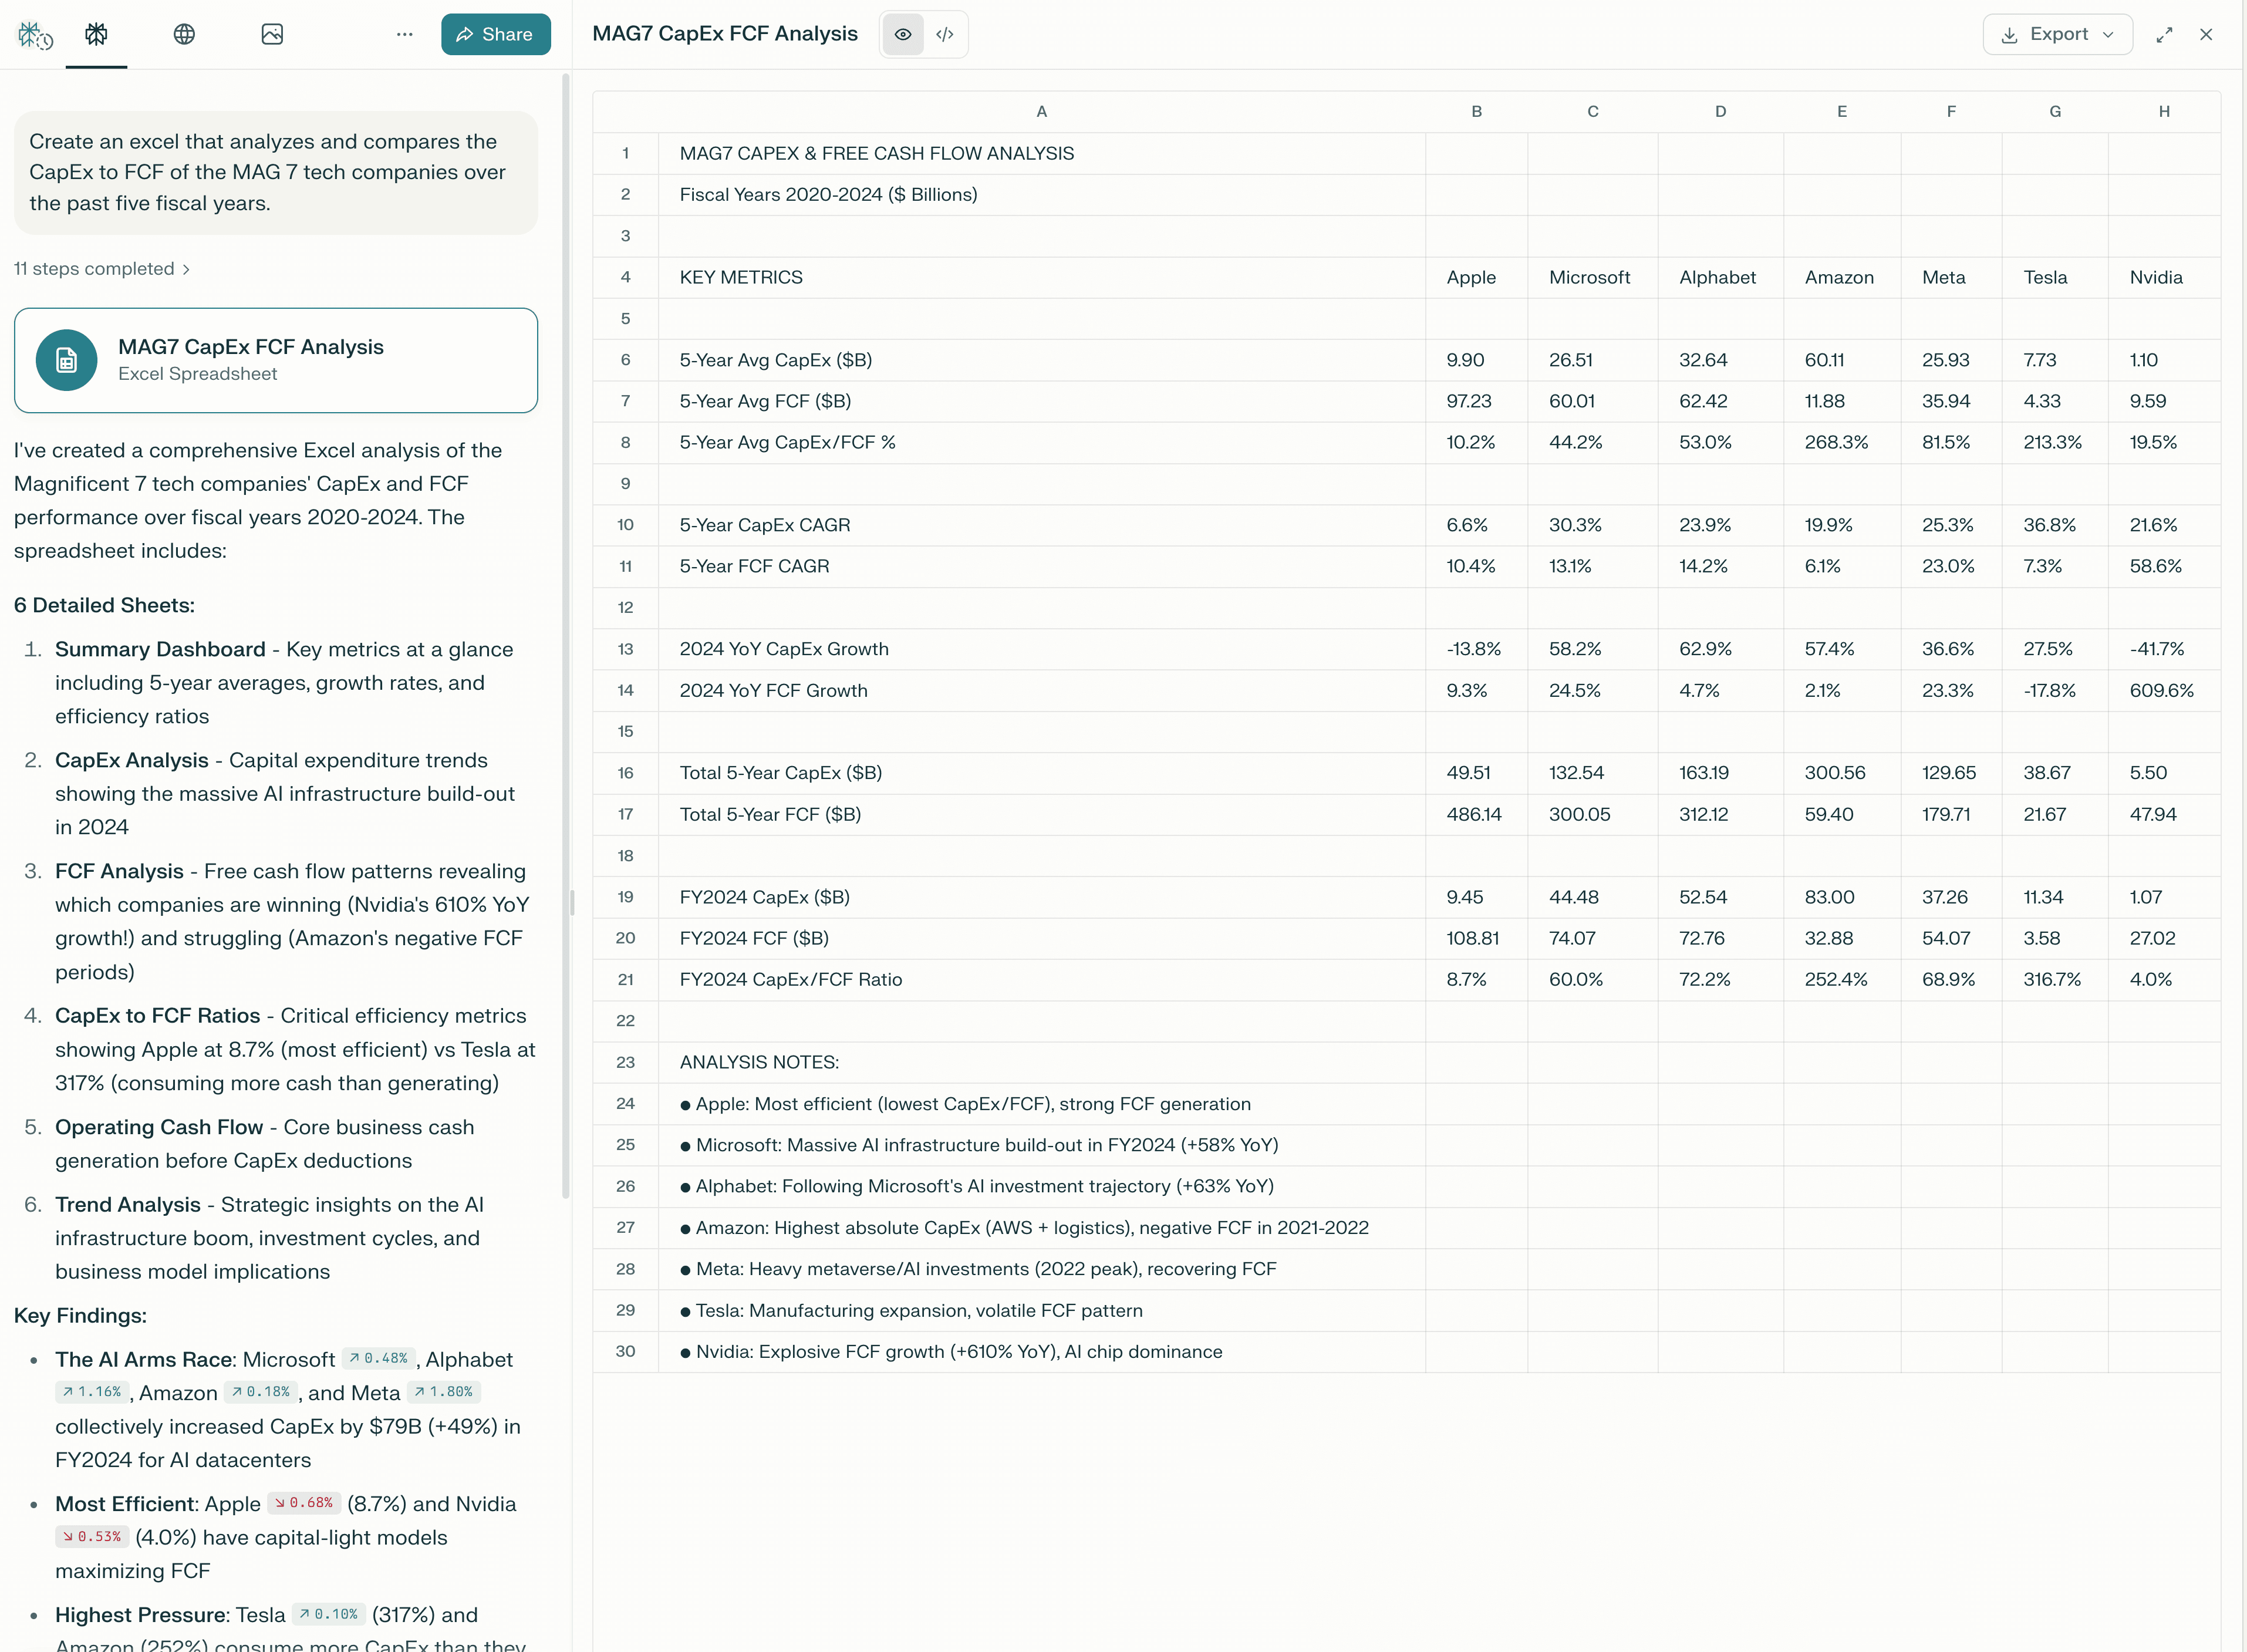
Ask Perplexity to build an Excel workbook that compares CapEx and FCF (free cash flow) across the MAG7 (Microsoft, Apple, Alphabet, Amazon, Meta, Nvidia, Tesla) with multi-year trends, ratios, dashboards, and key findings.


Key output

Perplexity produces a structured Excel model with detailed sheets and surfaces clear insights. The answer includes sourced citations, explains assumptions, and generates a .xlsx file that can be downloaded and shared.


Tips

  • Add constraints like currency format, CAGR (compound annual growth rate) windows, or specific companies if you want tighter control.

  • Ask Perplexity to highlight outliers or anomalies in the data and explain the causes.

  • Request follow-up analyses, such as forecasts, sensitivity tables, or scenario modeling.

  • For presentations, ask Perplexity to generate an executive summary or slide-ready visuals.