Your search
Compare NVIDIA, AMD, and Broadcom stocks.
Key output
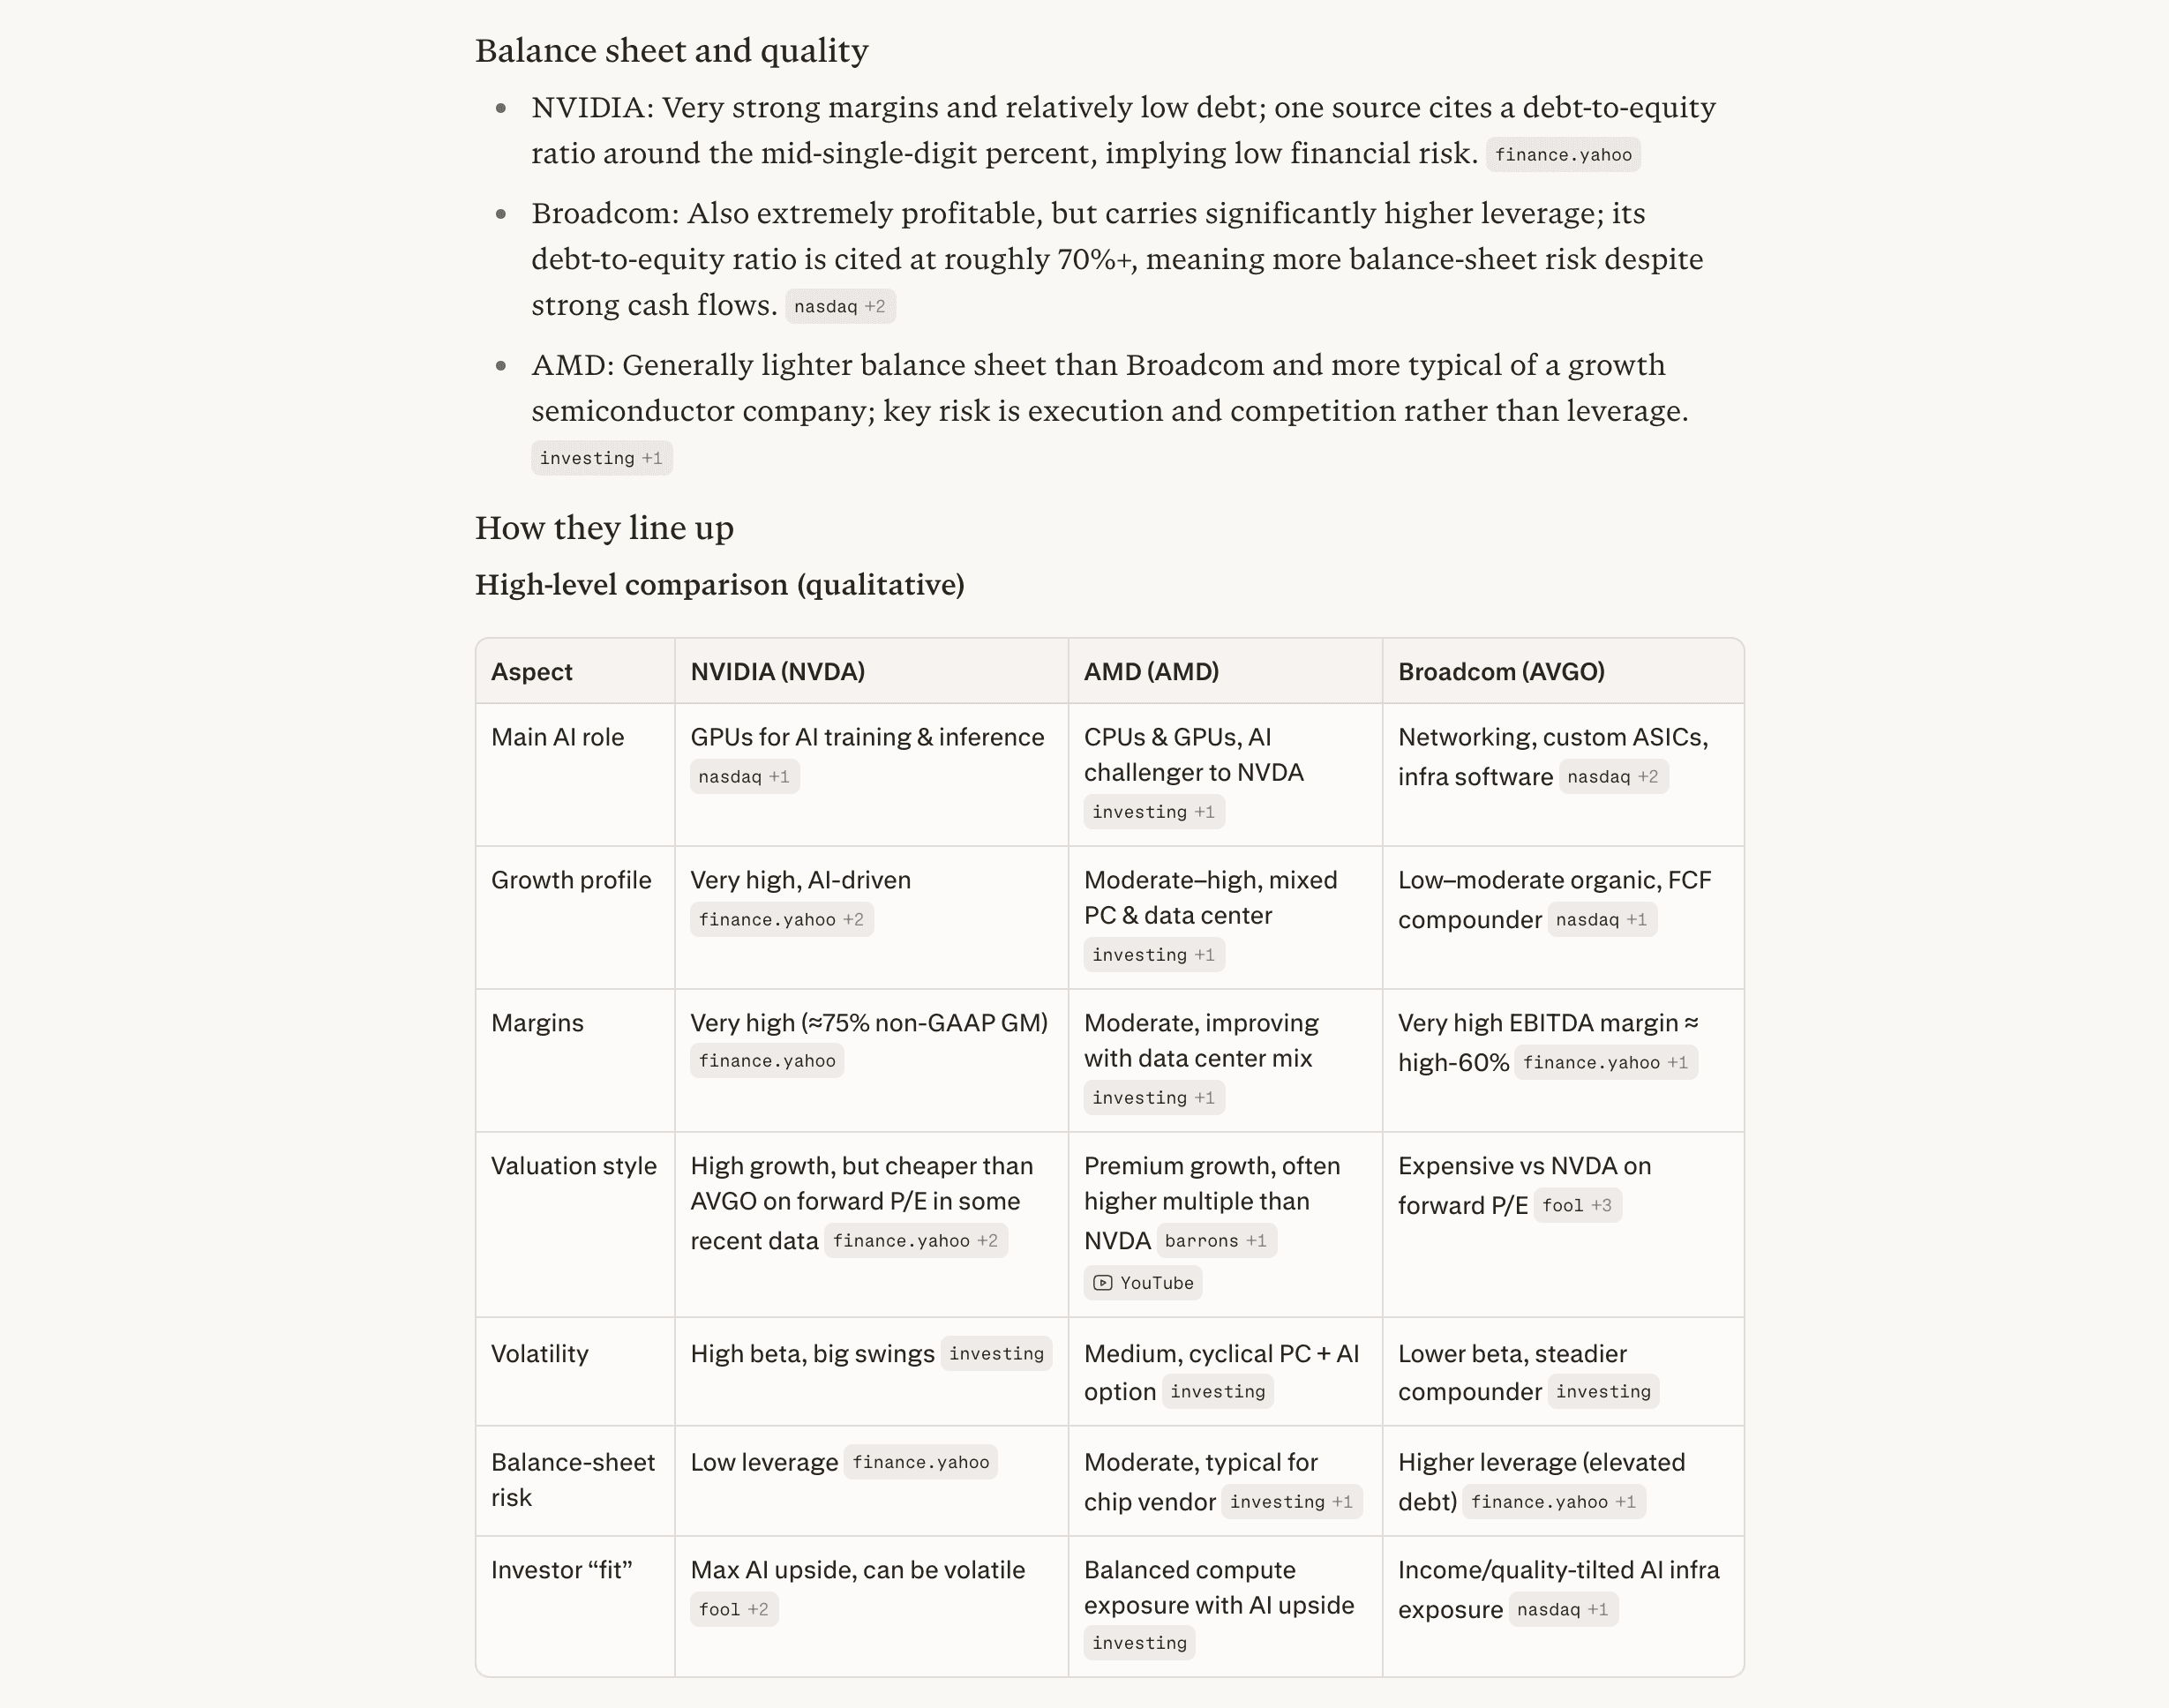
Perplexity generates a comprehensive multi-dimensional comparison including:
Real-time stock performance: Current price, daily change, YTD performance, 52-week range displayed in live interactive charts
Valuation metrics: P/E ratio, forward P/E, PEG ratio, price-to-sales, market capitalization
Financial performance: Revenue growth, profit margins, earnings per share, revenue trends
Analyst sentiment: Consensus ratings (buy/hold/sell), price targets, recent upgrades/downgrades
Recent catalysts: Earnings announcements, product launches, major partnerships, and news events affecting each stock
Technical indicators: Relative strength, momentum indicators, support/resistance levels

The comparison is presented as an interactive dashboard with side-by-side tables and performance charts. You can export this as a PDF investment brief, save the raw data as a CSV for your own analysis, or share an interactive link with your investment committee. Before finalizing, you can refine the analysis by asking follow-ups like "Which has the strongest balance sheet?" or "Show me 5-year revenue growth trends for all three."
Tips
Add timeframe context: "Compare performance over the last 6 months" or "since the beginning of 2025"
Request specific metrics: "Focus on free cash flow generation and return on invested capital"
Ask about fundamentals: "Which company has the best profit margins and why?"
Get forward-looking insights: "What are analysts saying about growth prospects for each?"
Understand risk factors: "What are the biggest risks unique to each company?"
Add more competitors: "Add Intel and Qualcomm to this comparison"
Request sector context: "How do these compare to the semiconductor sector average?"