Comet for Enterprise automatically collects data about how your organization uses it and how it performs.
To see more details, including each user's full list of extensions and policies, you can download the table.
Currently, Comet for Enterprise collects the following browser enrollments and metrics data:
-
User Email: Email address of the organization’s members that download, install and log in to Comet using their Perplexity Enterprise account.
-
Device ID: Unique ID assigned to the device used to log in to Comet.
-
Client ID: Unique identifier attached to a given browser/profile instance so that telemetry events from that instance can be correlated over time without directly identifying the human user.
-
Telemetry Created At: Date of record creation.
-
Telemetry Dm Token: Device‑management authorization token that proves the browser or device is enrolled with an enterprise management server.
-
Organization Uuid: Unique identifier for your Perplexity Enterprise organization.
-
Browser Version: Version of Comet at time of enrollment.
-
Channel: Update track used to deliver Comet builds with a particular stability and freshness profile (e.g. “stable”, “dev”, “canary”).
-
Extensions Count: Displays information about the extensions installed in each Comet instance. Detailed information for each extension, including names and details, is available when downloading the telemetry table.
-
IP Address: Displays the IP address linked to the Comet session.
-
Is OTR: Indicates if the session is Off-The-Record, i.e. whether Incognito mode and a guest profile are used.
-
Is Personal Search Enabled: Whether “Personal Search” is enabled or not. Personal Search lets the Comet assistant search and analyze a user’s browsing history and other personal data to answer questions, rather than only using the public web.
-
OS Name: Name of the operating system where the instance of Comet was installed.
-
OS Version: Version number of the operating system where the instance of Comet was installed.
-
OS Arch: Architecture of the operating system where the instance of Comet was installed. For example, “arm64” or “x86\_64”.
-
CPU Arch: Architecture of machine where the instance of Comet was installed. For example, “ARM\_64” or “x86\_64”.
-
Policy Count: Displays information about the policies deployed to the user’s browser. Detailed information for each policy is available when downloading the telemetry table.
Admins can schedule alerts via email, SFTP and webhooks. To do so:
Click on the Schedule button:

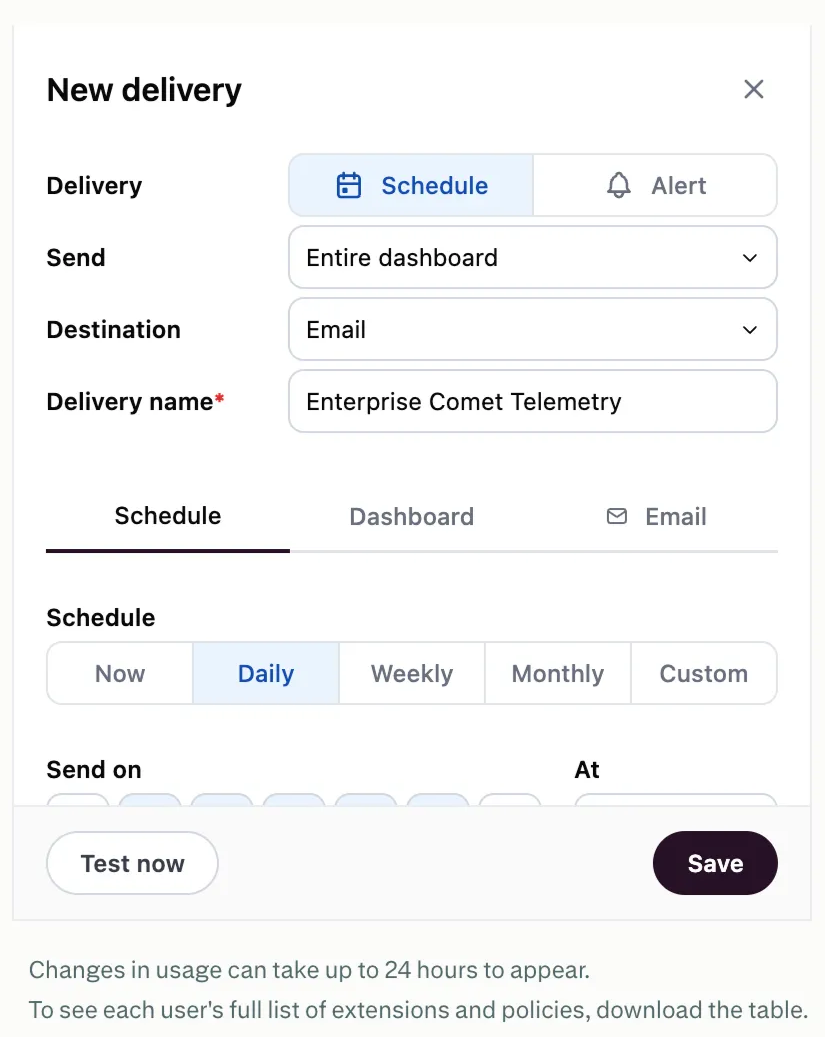
You will see a New delivery pop-up.
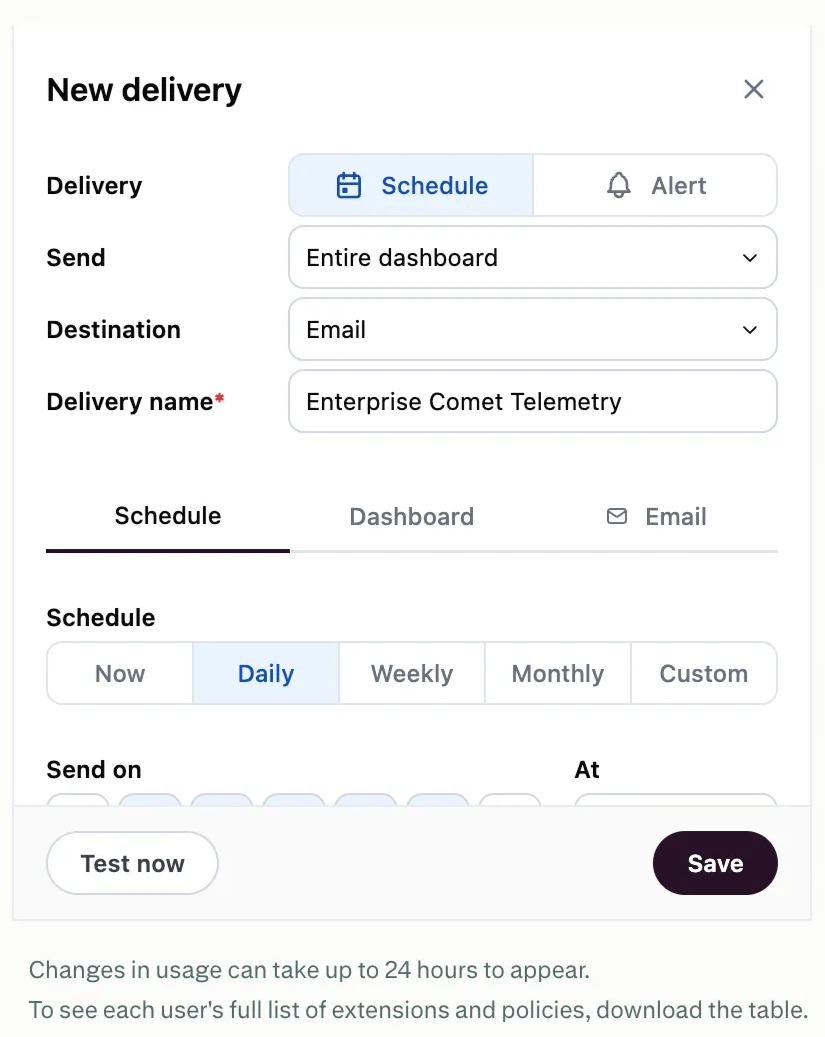
In Delivery, choose to schedule a usage report, or to set up alerts if the telemetry results meet a specific condition.
In Destination, you can choose the delivery method: email, SFTP, or webhook.
In Delivery name, you can give the report a name.
In Schedule, you can choose to send the report right away, or set up a daily, weekly, monthly or custom delivery schedule. You can set up a Cron string for the Custom schedule. If you choose to set up an Alert instead, you will be able to select the condition that needs to be met to trigger the alert, as well the scheduling options.
In the Dashboard, you can choose the delivery format (image, PDF, spreadsheet, or CSV), and whether to Expand tables (to ensure up to 1,000 rows are visible), Arrange dashboard tiles in a single column, and/or Hide title.
In Email, you can add a File Name, Recipients, email Subject and Body. You can also Personalize content with the recipient's user attributes.
When you’re done, you can test the report/alert delivery, and Save it to set it live.